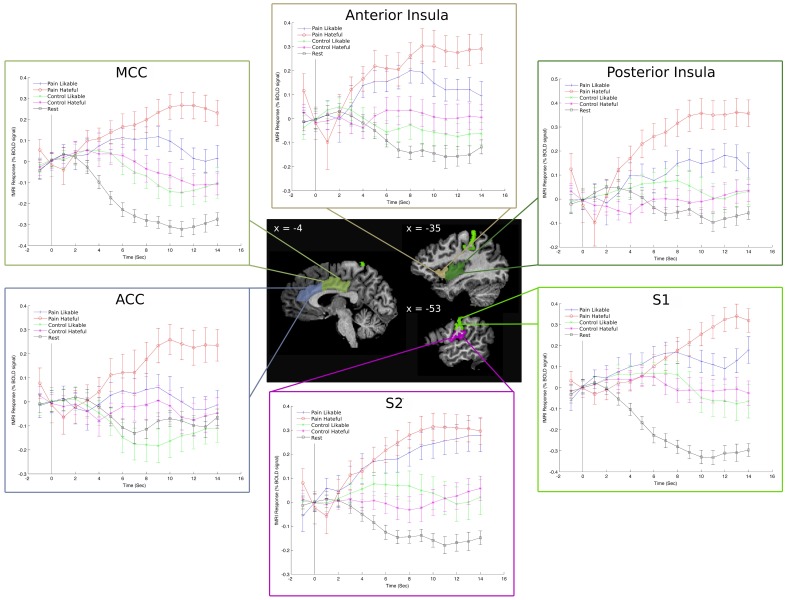
Figure 3.
Event Related Averages for the percent signal change in each condition in left-hemisphere hand-drawn ROIs. The “rest” line refers to the time course of activity during the rest condition and is there as a comparison to the video-based stimuli. These plots reveal a clear separation among the five conditions throughout the time course of the stimulus presentation and show that the overall result of greater activity for viewing hateful targets in pain is consistent throughout the time course.

