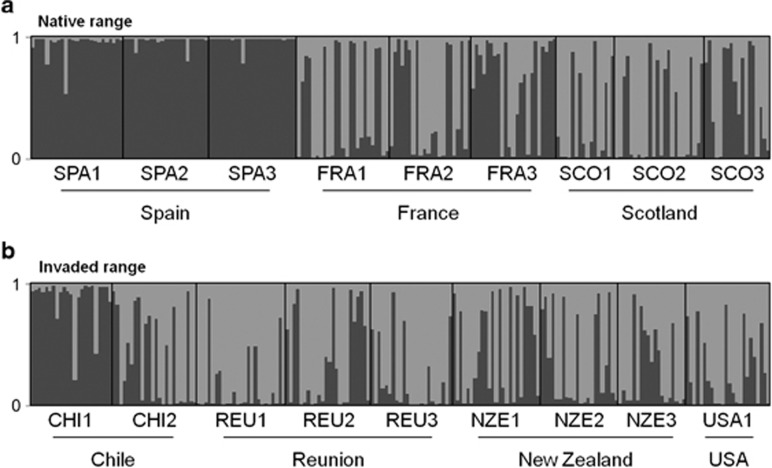
Figure 2.
(a, b) Assignment probabilities of membership to the two inferred clusters, based on the multilocus genotypes. Each individual is represented as a vertical line with proportional assignment to cluster 1 in dark grey and proportional assignment to cluster 2 in light grey. Vertical black lines separate the individuals from the different sampled populations.

