
Figure 2.
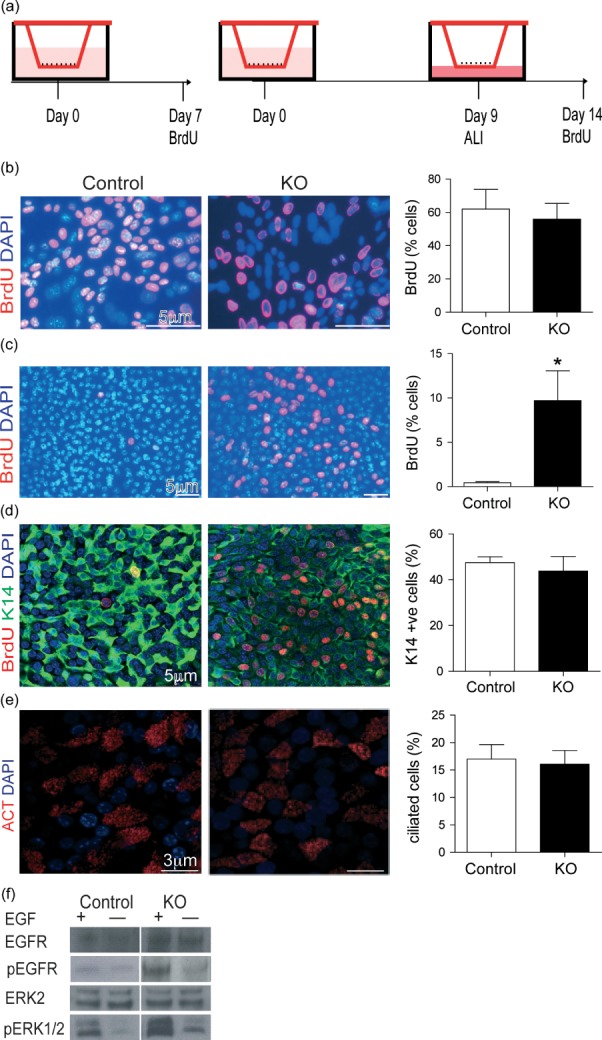
Lrig1−/− (KO) tracheal epithelial cells show continued proliferation at cell confluence in air–liquid interface culture. (a) Diagram of ALI culture and experimental time points. (b) Immunostaining of BrdU in MTEC culture pre-confluence and corresponding quantification (KO versus control, 55.9% ± 9.5% versus 62.0% ± 11.8%, p > 0.05, n = 4). (c) Immunostaining of BrdU in MTEC cultures at day 14 (5 days after cell confluence) showed increased BrdU immunostaining in Lrig1−/− MTECs compared with controls (9.7% ± 3.4% versus 0.5% ± 0.1%, p = 0.03, n = 4). (d) Co-staining of keratin 14 (K14, green) with BrdU (red) and (e) acetylated tubulin (ACT, red), showing no difference between KO and control MTEC differentiation at ALI culture day 14 (control cells K14-positive 47.0% ± 11.4% versus KO cells 54.2% ± 9.2%, p > 0.05; control cells ACT-positive 17.0% ± 2.6% versus KO cells 16.1% ± 2.5%, p > 0.05). (f) Immunoblots showing increased ERK1/2 phosphorylation of KO MTECs compared with controls. Cells were growth factor-starved for 14 h and then stimulated or not for 30 min with 20 ng/ml EGF. All statistical values, mean ± SEM; Mann–Whitney U-test.