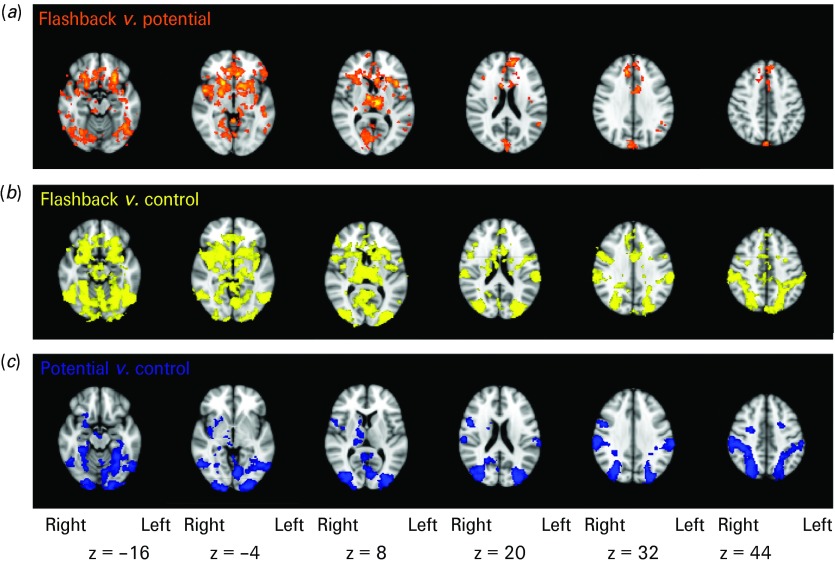
Fig. 2.
Contrast analysis of flashback versus potential versus control film scenes. Contrast analysis showing areas of increased blood oxygen level-dependent (BOLD) response (p < 0.05 cluster corrected) rendered onto the Montreal Neurological Institute (MNI) 2 mm standard brain. (a) Areas with greater activation when viewing flashback relative to potential scenes (orange). (b) Areas with greater activation when viewing flashback relative to control scenes (yellow). (c) Areas with greater activation when viewing potential relative to control scenes (blue).

