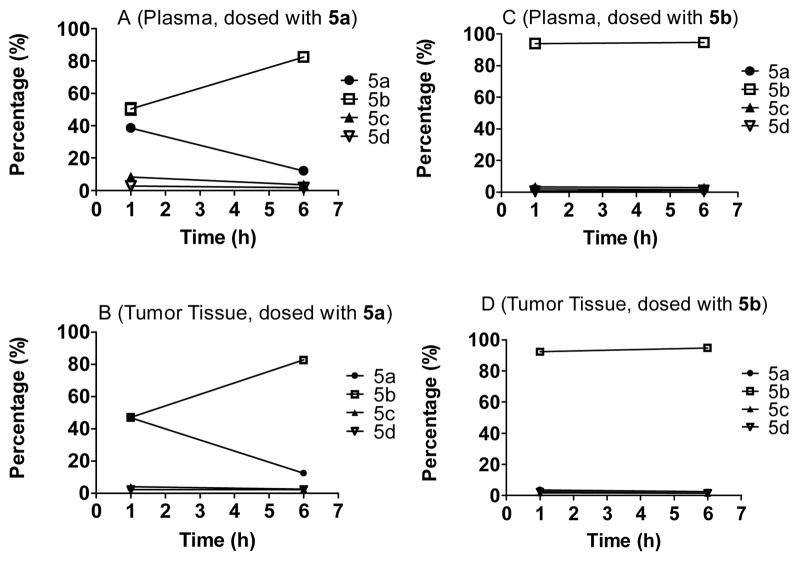
Figure 8.
Isomerization of 5a and 5b in tumor tissue or plasma. Panels A and B depict the isomerization of 5a and panels C and D depict the isomerization of 5b in plasma and tumor tissue accordingly. The proportion of compounds is on the Y axis and the time when samples were harvested is on the X axis. Bars indicate the standard error.

