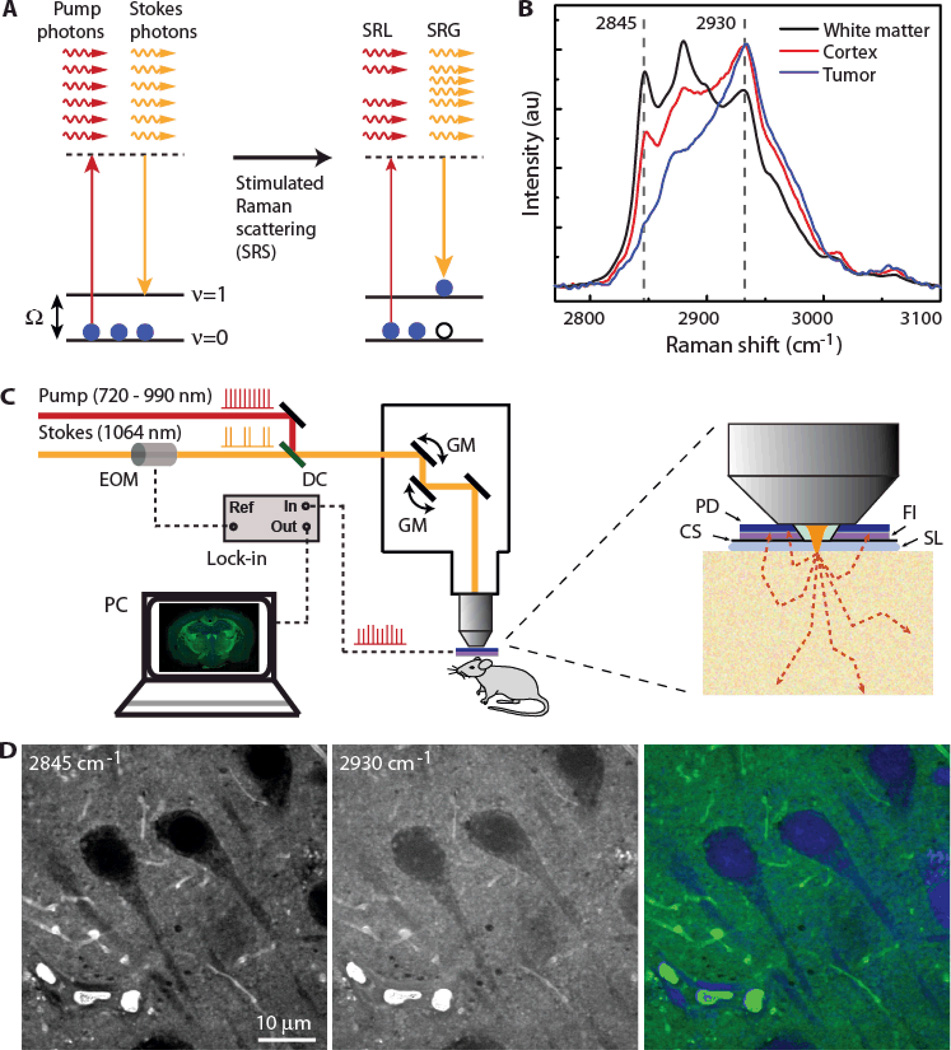
Figure 1. Two-color SRS microscopy.
(A) Energy diagram of the SRS process, where pump and Stokes photons excite the ground state (ν=0) molecules to their vibrational excited state (ν=1), resulting in the reduction of pump intensity–stimulated Raman loss (SRL) and the increase in Stokes intensity–stimulated Raman gain (SRG). (B) Raman spectra from frozen sections of a mouse brain with human GBM xenografts show white matter, cortex, and tumor. The marked frequencies at 2845 cm−1 and 2930 cm−1 were chosen for two-color SRS imaging. (C) Experimental setup of epi-SRS microscopy. Stokes beam was modulated at high frequency (10 MHz), and the weak SRL signal was demodulated by a lock-in amplifier. Epi-detection scheme was used for in vivo brain imaging and ex vivo imaging on fresh tissues. CS, coverslip; DC, dichroic mirror; EOM, electro-optical modulator; FI, optical filter; PD, photodiode; SL, saline. (D) Neurons in gray matter were imaged at 2845 cm−1 (left) and 2930 cm−1 (middle). A linear combination of the two raw images was used to compute the distributions of lipid (green) and protein (blue), shown in a composite image (right).

