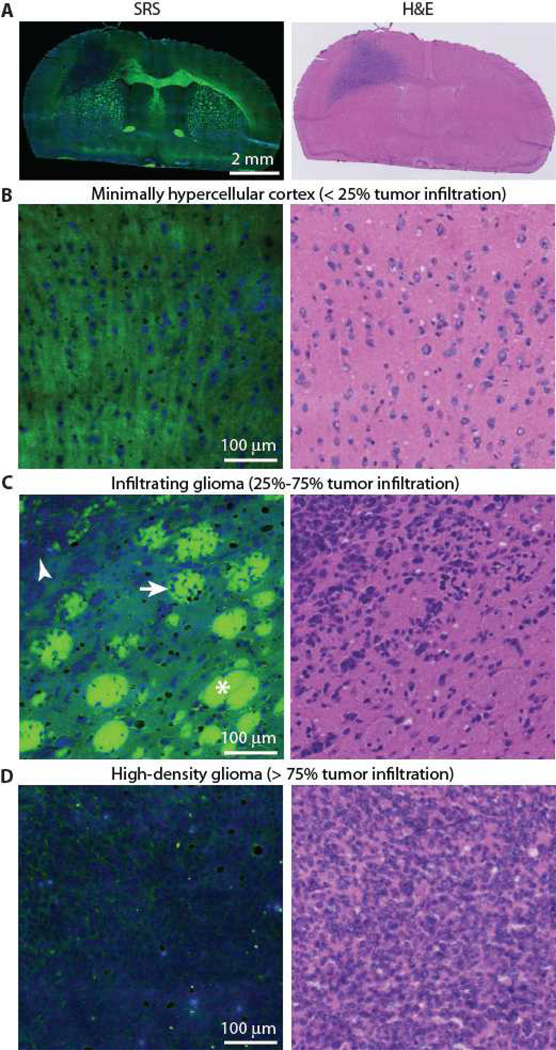
Figure 3. SRS and H&E images of frozen human GBM xenografts.
Images are representative of 6 mice. Images were taken with SRS microscopy, and then stained with H&E for comparison. Lipids have been assigned to the green channel and proteins to the blue channel. (A) A thin (10 µm), full section of snap-frozen brain from implanted human GBM xenograft in mice. (B) High-magnification view of normal to minimally hypercellular cortex. (C) Infiltrating glioma with normal white matter bundles (asterisk), tumor-infiltrated bundles (arrow), and dense tumor cells (arrowhead). (D) High-density glioma. FOVs similar to these were used to populate the Web-based survey to quantitatively compare SRS and H&E microscopy.

