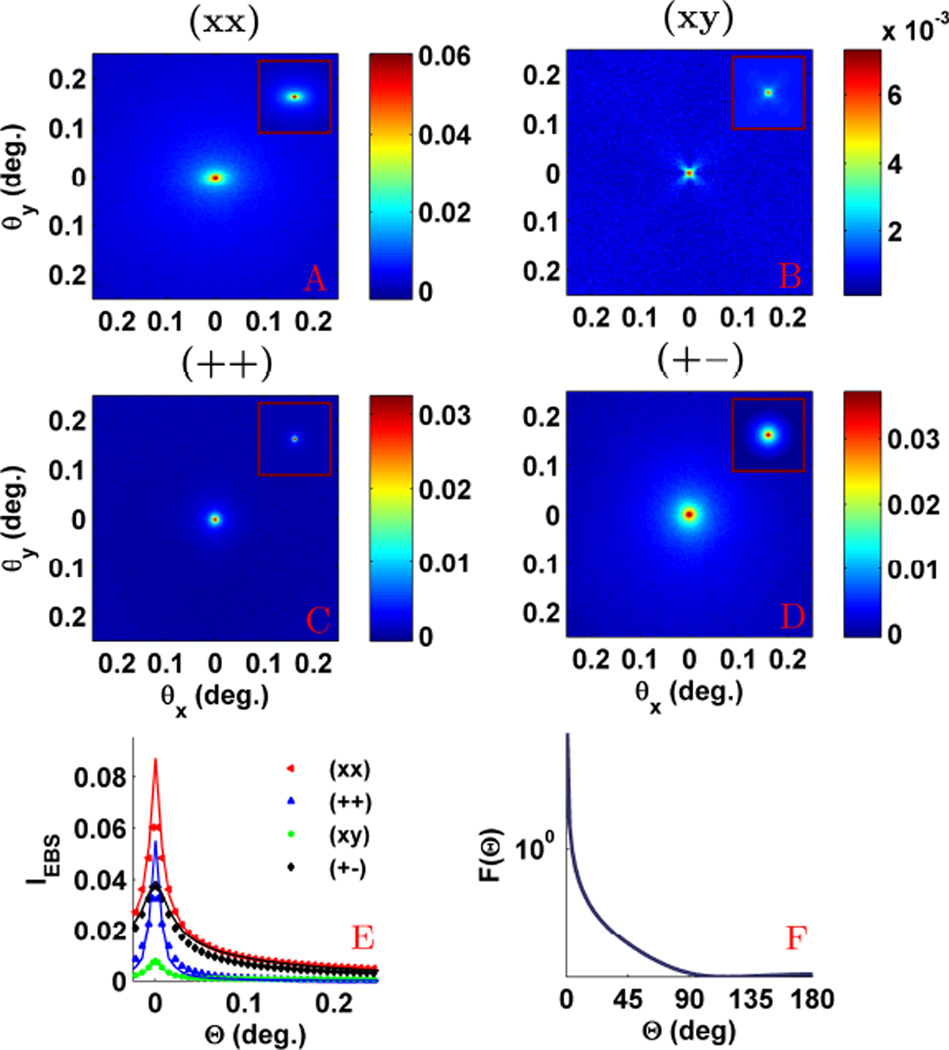
Fig. 12.
Experimental EBS measurement from a chicken liver sample at 700 nm illumination. (a–d) shows the EBS peaks in the (xx), (xy), (++), and (+−) polarization channels, respectively. (e) Rotational averages of each polarization channel with symbols representing experiment. The WM fit is shown in solid lines for the (xx) and (++) channels. (f) WM phase function for g = 0.95 and D = 2.2. Simulation scaled by 0.65 to obtain a match with experiment.

