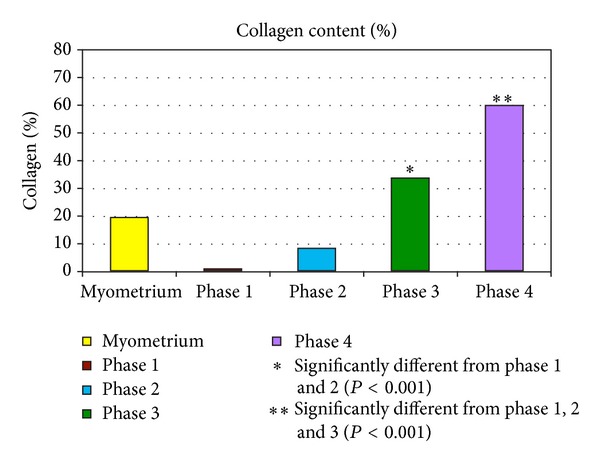
Figure 2.

Mean percent collagen content of fibroid phases 1–4 by image analysis. The bar graph depicts the progressive accumulation of collagen in the transition from phase 1 to 4. There were 5 samples per phase group and the values represent the means. The myometrial bar is the mean value of 8 samples. *Significantly different from phases 1 and 2 (P < 0.001). **Significantly different from phases 1, 2 or 3 (P < 0.001).
