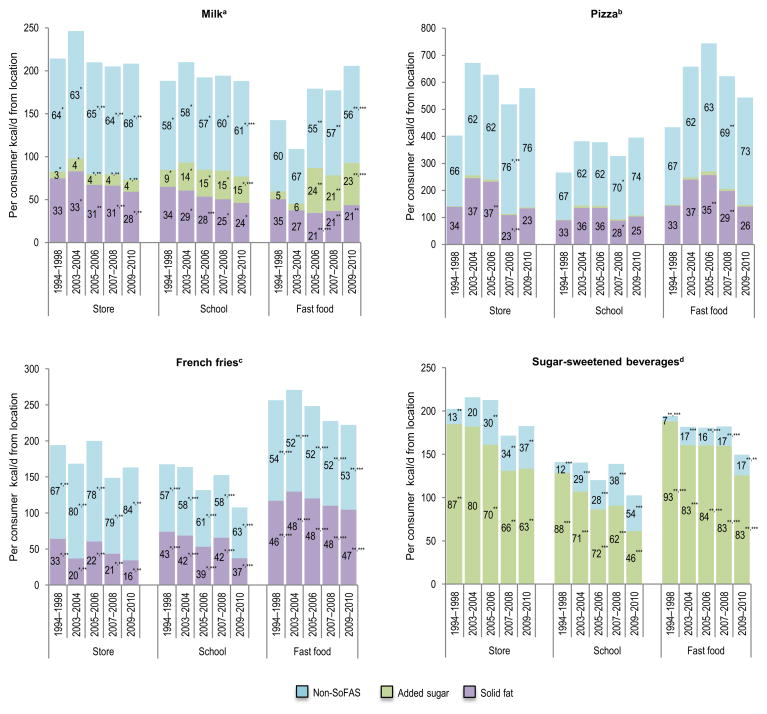
Figure 1.
Added sugar and solid fat content of milk, pizza, french fries, and sugar-sweetened beverages consumed by children from stores, schools, and fast-food restaurants, 1994–2010 Note: Data for children aged 2–18 years from CSFII 1994–1998 and NHANES 2003–2010. Numbers in bars are the percentage of food group kcal per day from non-SoFAS calories, added sugar, and solid fat at each location. Significance testing compares values in a given year for all pairwise comparisons of locations.
a Includes all types of milk such as whole, 2%, 1%, and nonfat milks (plain, chocolate, and flavored)
b Includes all types of pizza, calzones, and pizza rolls
c Includes french fries, home fries, and hash browns
d Includes regular, low-calorie, and diet sugar-sweetened beverages such as soft drinks, fruit drinks, sports drinks, and energy drinks
* Store and school are significantly different
** Store and fast food are significantly different
*** School and fast food are significantly different
kcal/d, kilocalories per day; SoFAS, total energy from solid fat and added sugar
CSFII, Continuing Survey of Food Intakes by Individuals; NHANES, National Health and Nutrition Examination Survey

