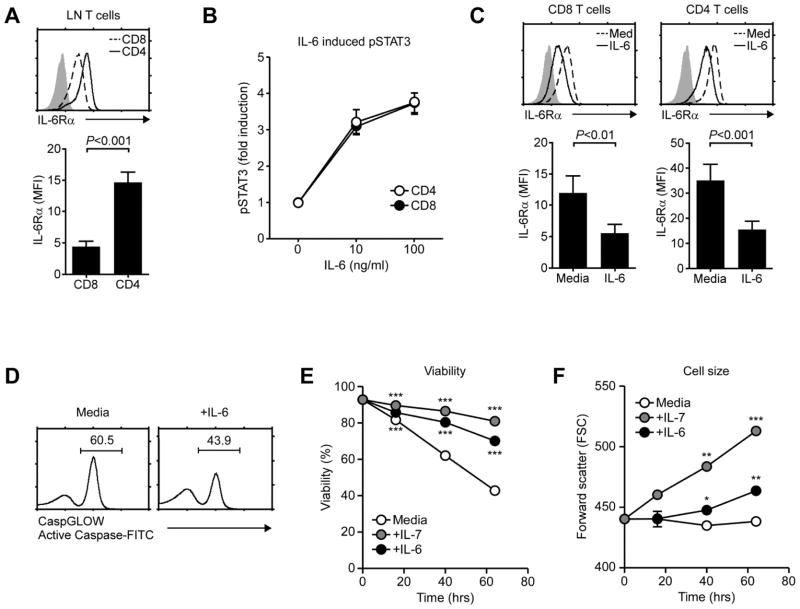
Fig. 1. IL-6 promotes T cell survival in vitro.
(A) IL-6Rα expression on LN T cells. IL-6Rα levels were determined on freshly isolated CD4 and CD8 LN T cells (top) and quantified in mean fluorescence intensities (MFI) (bottom). Results show the mean +/− SEM of five independent experiments.
(B) IL-6 signaling in CD4 and CD8 T cells. Phospho-STAT3 (pSTAT3) contents upon IL-6 signaling were assessed in wildtype CD4 and CD8 T cells by intracellular staining. Data show the summary of eight independent experiments.
(C) IL-6Rα levels on IL-6 stimulated LN T cells. LN T cells were incubated overnight with IL-6 or medium alone. Next day, surface IL-6Rα levels were assessed on CD4 and CD8 T cells (top). Bar graphs show the mean +/− SEM of IL-6Rα levels from seven independent experiments.
(D) Total caspase activity upon IL-6 stimulation. Purified LN T cells were cultured for 48 hours with IL-6 or medium alone. Caspase activities were assessed by incubation with FITC-conjugated caspase inhibitor peptides. Histograms show representative results from three independent experiments.
(E) Survival curve of IL-6 treated T cells. Purified LN T cells were cultured in medium, IL-7 or IL-6 for the indicated time. Cell viability was determined by propidium iodide exclusion. Data are the summary of four independent experiments. ***P<0.001, two-tailed Student’s t-test.
(F) Cell size assessment of IL-6 treated T cells. LN T cells were cultured in media, IL-7 or IL-6 for the indicated time. Cell sizes were determined by Forward Scatter (FSC) analysis. Data are the results of three independent experiments. *P<0.05; **P<0.01; ***P<0.001, two-tailed Student’s t-test.

