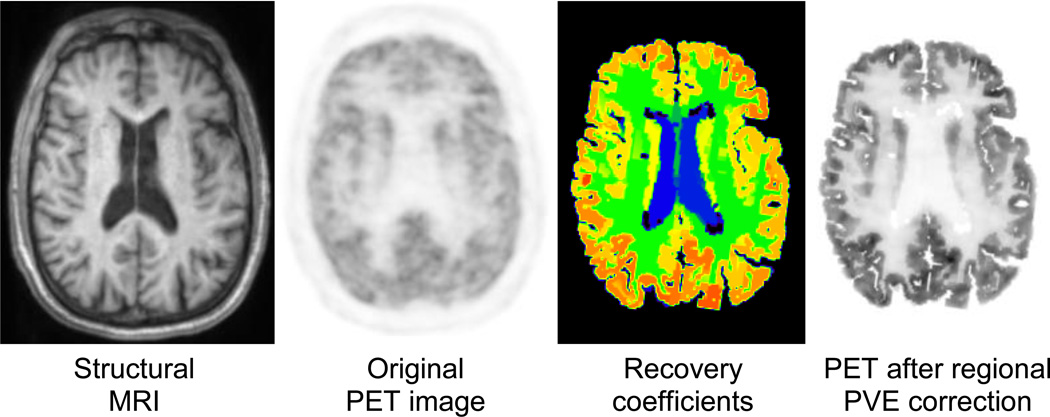
Figure 3.
Influence of MR-based PVE correction on PET image contrast for a “normal” brain. From left to right, the MR image used to automatically segment ROIs of multiple brain structures, the original PET image, PVE correction factors for mean ROI values calculated via the geometric transfer matrix method using the segmented MR and original PET images as inputs, and the original PET image after application of the recovery coefficients. Data acquired on the BrainPET prototype, Martinos Center, MGH. Images courtesy of Spencer Bowen, PhD.

