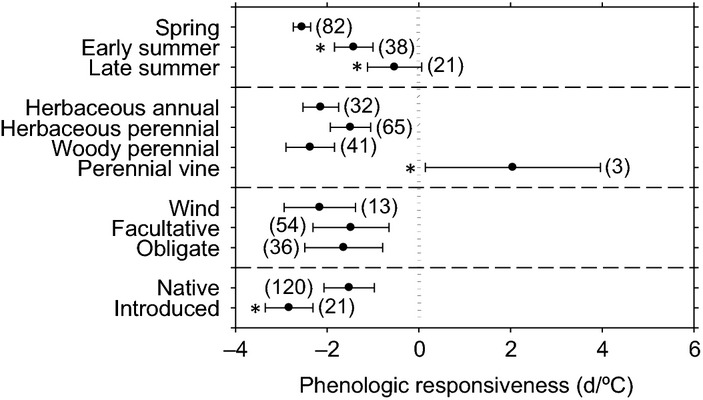
Figure 3.

Phenological responsiveness to increasing temperature within different plant functional groups. Mean ± 1 SE with the number of species per group indicated in parentheses. Asterisks indicate a significant difference from the reference group, which is the topmost group in a sub-panel (P = 0.05).
