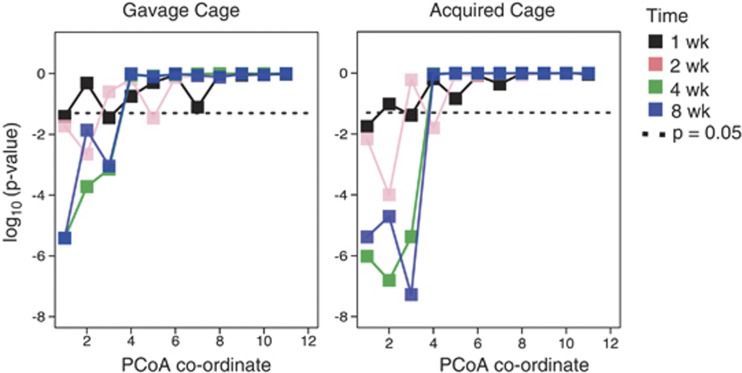
Figure 4.
Cage effects illustrated through the use of Bray–Curtis PCoA performed at the OTU level. Shown for the first 12 PCoA co-ordinates are the P-values from a one-way ANOVA with a fixed factor of cage evaluating the null hypothesis that cage had no effect on the distribution of the co-ordinate.

