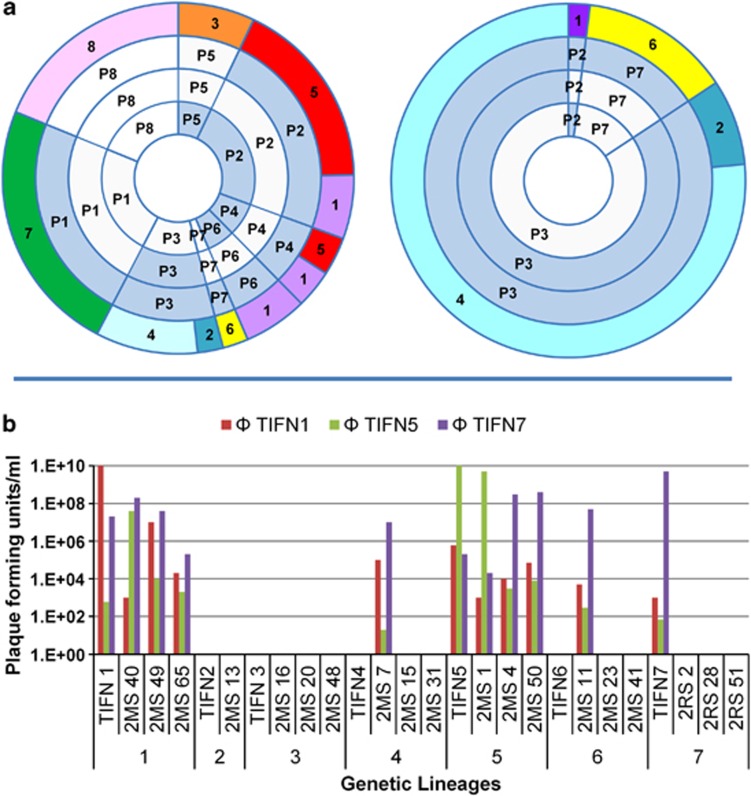
Figure 4.
Plasmid profiles and phage sensitivities of starter culture isolates. (a) Plasmid profile distribution of the isolates from propagated starter culture (left chart) and from 2-week-ripened cheese (right chart). First circle represents the amplified fragment length polymorphism (AFLP)-derived genetic lineage classifications. Inner circles represent the corresponding plasmid profiles. Hybridization of lac-operon, citrate permease and protease permease probes to the plasmid profiles are indicated on second, third and fourth circles, and hybridized, not-hybridized and not-determined are indicated with blue, gray and white filling colors, respectively. (b) Phage sensitivity levels of isolates from propagated starter culture within and between genetic lineages.

