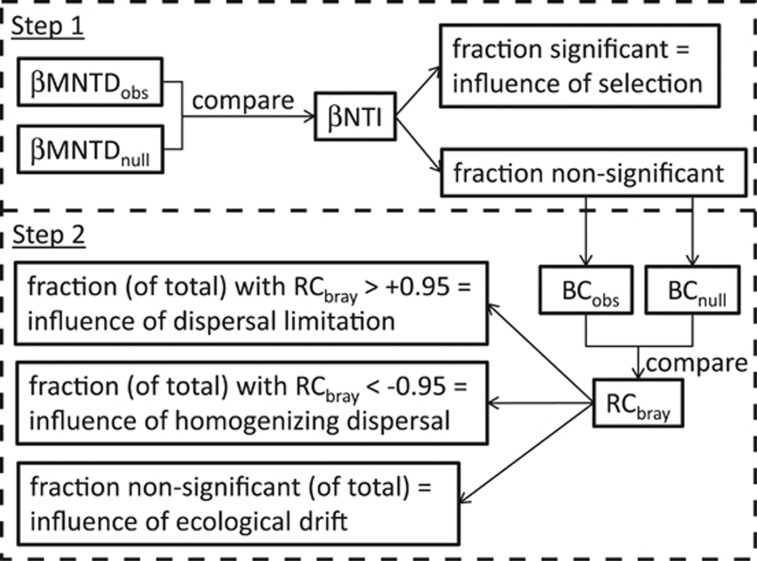
Figure 3.
Flowchart summarizing procedure for estimating influences of ecological processes, broken into two major steps discussed in the section ‘Estimating influences of ecological processes.' First, the observed degree of phylogenetic turnover for each pairwise community comparison was quantified (βMNTDobs). A randomization was then used to generate a null distribution of phylogenetic turnover (βMNTDnull). The value of βNTI characterizes the magnitude of deviation between βMNTDobs and βMNTDnull. The fraction of pairwise comparisons with significant βNTI values (|βNTI|>2) is the estimated influence of Selection. As part of the second major step in our procedure, pairwise comparisons with nonsignificant βNTI values were further evaluated by comparing observed Bray–Curtis (BCobs) to Bray–Curtis expected under the randomization (BCnull). The value of Bray–Curtis-based Raup–Crick (RCbray) characterizes the magnitude of deviation between BCobs and BCnull; a value of |RCbray|>0.95 was considered significant. The number of pairwise comparisons with RCbray>+0.95, the number with RCbray<−0.95 and the number with |RCbray|<0.95 were each divided by the total number of all pairwise comparisons; the resulting fractions estimate the influence of Dispersal Limitation combined with Drift, Homogenizing Dispersal and Drift acting alone, respectively.

