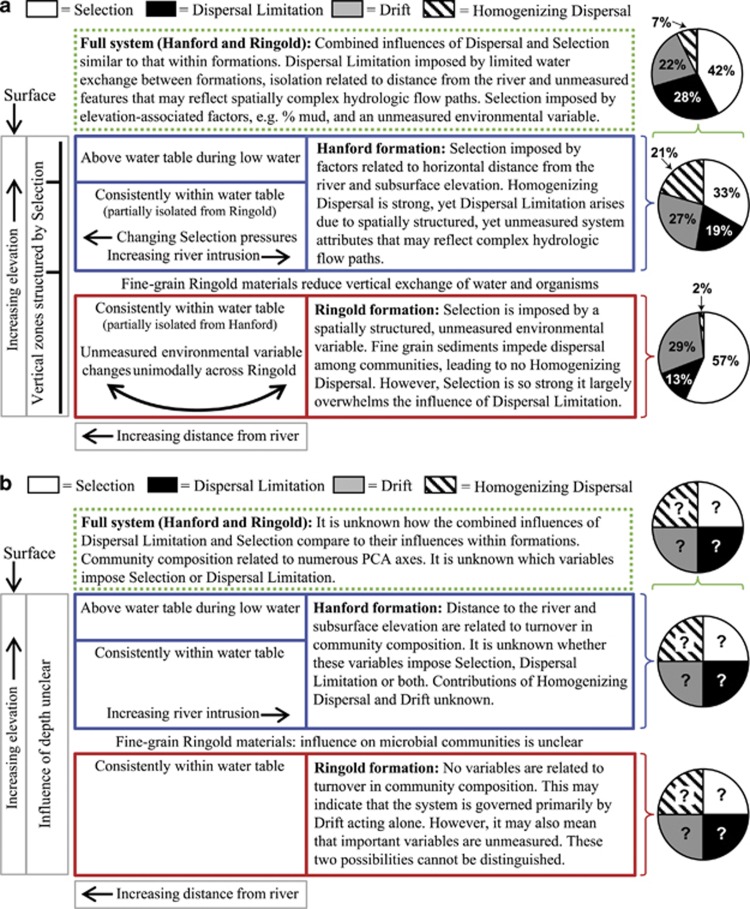
Figure 4.
Summary of key insights and results for the three systems analyzed: Hanford (blue) and Ringold (red) formations and across the full system (green dashed box). For comparison, panels provide inferences based on (a) the framework developed here and (b) a preexisting framework. Pie charts give the percent of turnover in community composition governed primarily by Selection acting alone (white fill), Dispersal Limitation acting in concert with Drift (black fill), Drift acting alone (gray fill) and Homogenizing Dispersal (line fill).

