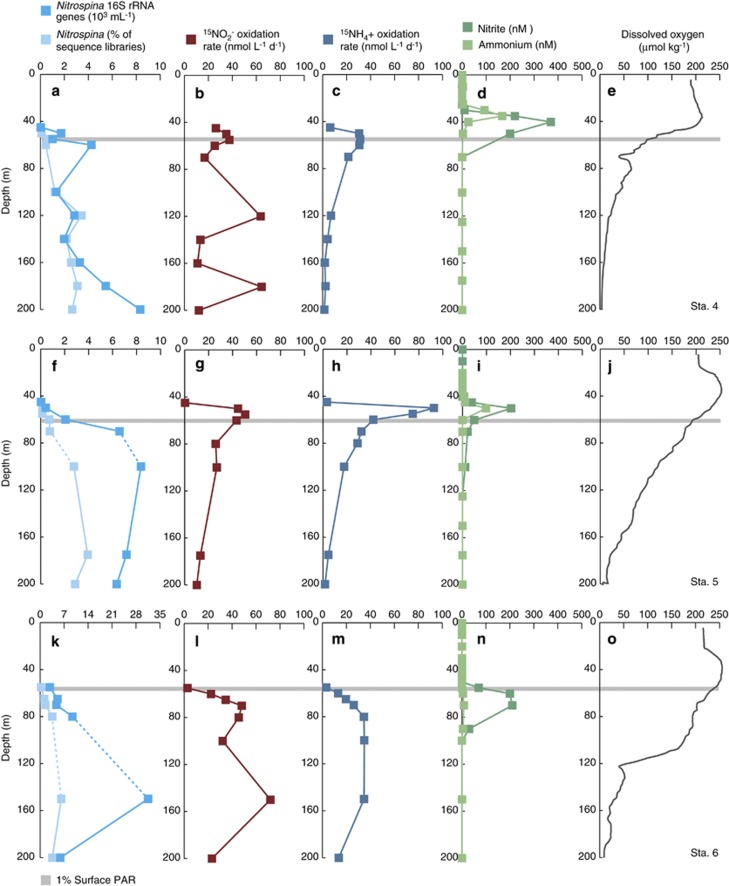
Figure 3.
Depth profiles from (a–e) station 4, (f–j) station 5 and (k–o) station 6 in the ETNP and GOC. (a, f, k) QPCR data (103 16 S rRNA genes per ml) and pyrosequencing data (expressed as % of total 16S rRNA sequence for a given sample) for Nitrospina; (b, g, l) 15NO2− oxidation rates (in nmol l−1 d−1); (c, h, m) 15NH4+ oxidation rates; (d, i, n) NH4+ and NO2− (nmol l−1); and (e, j, o) DO concentrations (μmol kg−1). Standard errors for QPCR fall within the width of the data points, and dashed lines connecting data points denote presence of DNA samples with QPCR inhibition (which are subsequently excluded from statistical analyses). The gray line denotes the depth of the euphotic zone, and all data are plotted to 200 m depth. Note that horizontal axes vary between a, f and k, but b, g, l and c, h, m are plotted on identical axes to allow comparison between 15NO2− and 15NH4+ oxidation rates.

