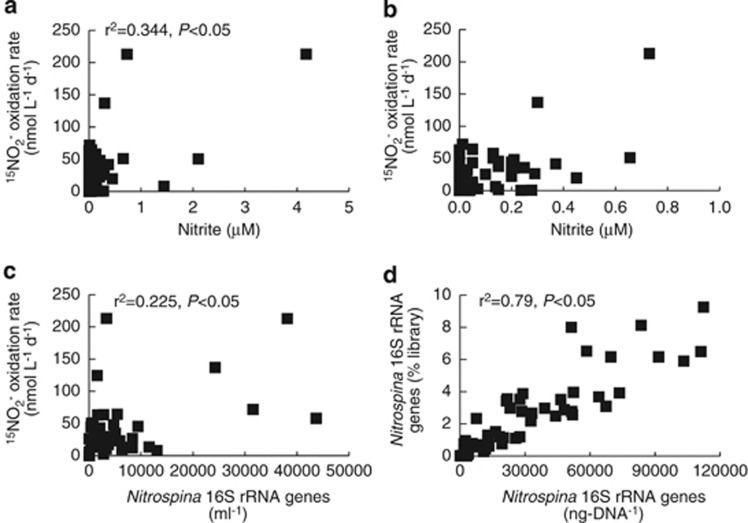
Figure 4.
Correlations between 15NO2− oxidation rates and (a and b) NO2− concentrations and (c) Nitrospina 16S rRNA gene abundance (ml−1) based on QPCR. In b, data points with>1 μM NO2− are not shown in order to show points near the axes. (d) Correlation between Nitrospina as a percentage of pyrosequencing libraries (vertical axis) and Nitrospina 16S rRNA gene abundance (ng-DNA−1) based on QPCR (horizontal axis). QPCR data are normalized per ng-DNA rather than per ml to reflect Nitrospina 16S rRNA genes as a proportion of community DNA.

