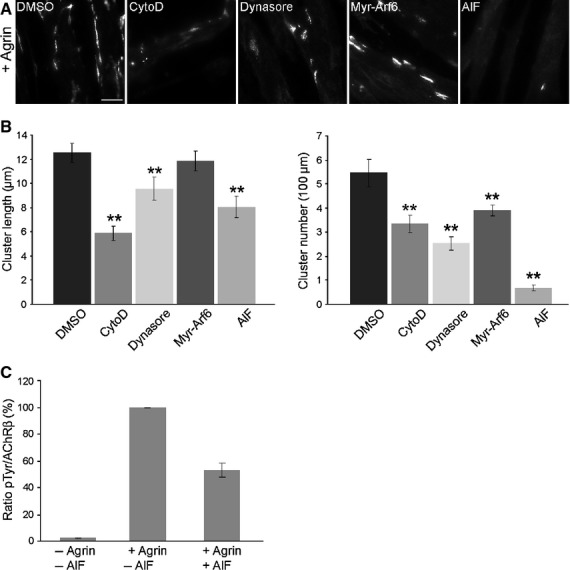
Fig 8.

Arf6 modulates agrin-induced AChR clustering. (A) C2 myotubes were stimulated with agrin in the presence of dimethylsulfoxide, cytochalasin D, dynasore, myr-Arf6 or AlF. AChRs were stained with α-BGT and visualized by fluorescence microscopy. Scale bar = 25 μm. (B) Quantification of cluster length and cluster number/100 μm is shown. Error bars indicate the SEM (n > 50). (C) C2 myotubes were treated with agrin for 60 min in the absence or presence of AIF. AChRs were purified using an α-BGT pull-down followed by immunoblotting using antibodies against phosphotyrosine (pTyr) and AChR β, respectively. Quantification of AChR β phosphorylation is shown. Error bars indicate the SEM (n = 4).
