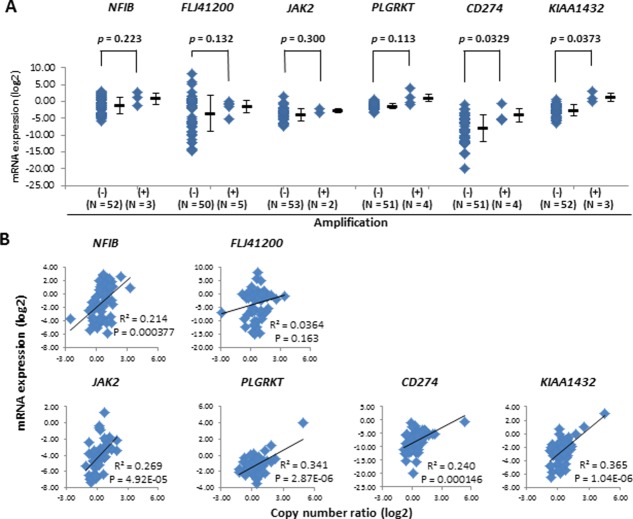
Figure 2.
Association of copy numbers with expression levels in the 9p23-24 genes in SCLC cells. Levels of mRNA expression were quantified as ΔCt values using the HPRT1 gene as a control. Levels relative to normal lung were calculated using Human Lung Poly-A(+) RNA (Clontech) as the calibrator. (A) Levels of mRNA expression (log2) quantified by real-time RT-PCR in amplified (+) and not amplified (–) SCLCs. P-values by Student’s T-test for differences are shown. (B) Correlation of copy number ratios by real-time genomic-PCR with mRNA expression levels by real-time RT-PCR among 55 SCLCs.

