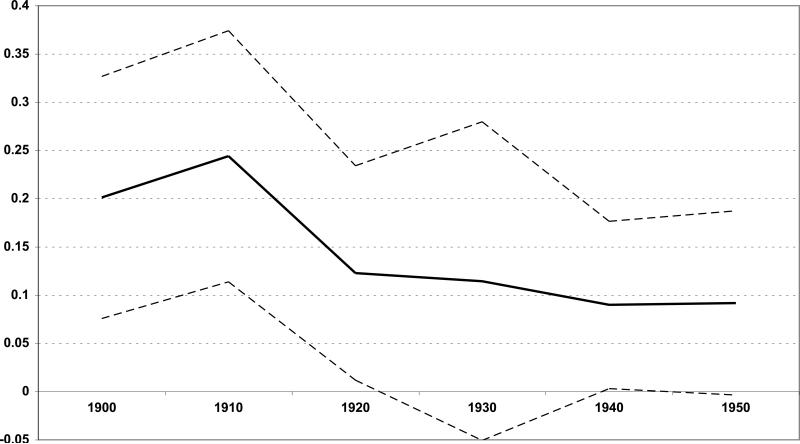
Figure 4.
Impact of 1910 Hookworm Infection Rate on Fertility.
Notes: The y axis plots the year-specific coefficients on the circa 1913 hookworm-infection rate (solid line), plus the 95%-confidence intervals (dashed lines). The x axis is the Census year. The sample consists of all native-born white and black females in the IPUMS between the ages of 8 and 16 in the RSC-surveyed geographic units for 1900, 1910, 1920, 1930, 1940, and 1950. For each year, the coefficients are estimated in a regression of fertility (the number of own children under 5 years old in the household) on pre-intervention hookworm infection and demographic controls. Standard errors are clustered on SEA.

