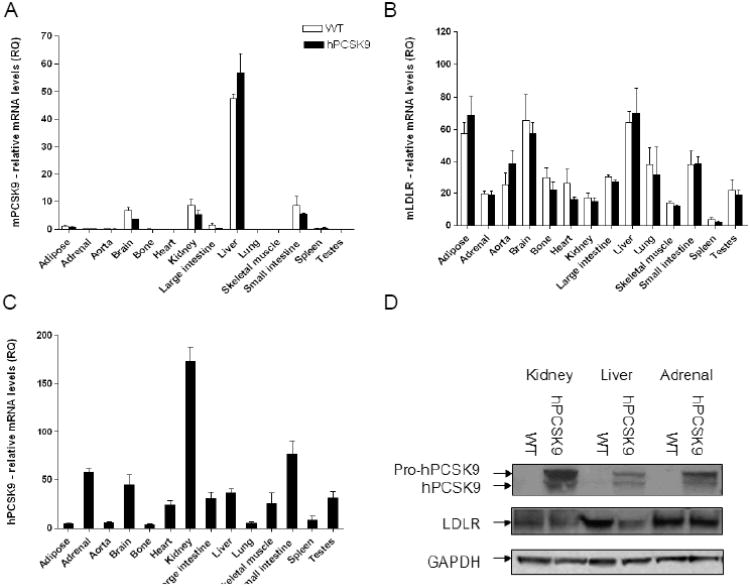
Figure 1.
PCSK9 and LDLR levels in WT and hPCSK9 transgenic mice tissues. Relative mRNA expression of (A) mPCSK9, (B) mLDLR, and (C) hPCSK9. Expression levels were calculated using real-time PCR ΔΔCT method. Each tissue was measured in duplicate using 3 mice in each group (n=3). (D) Representative immunoblot of hPCSK9, LDLR and β-actin in WT and hPCSK9 transgenic mice (quantitative analysis is shown in supplementary Figures 1A and 1B).

