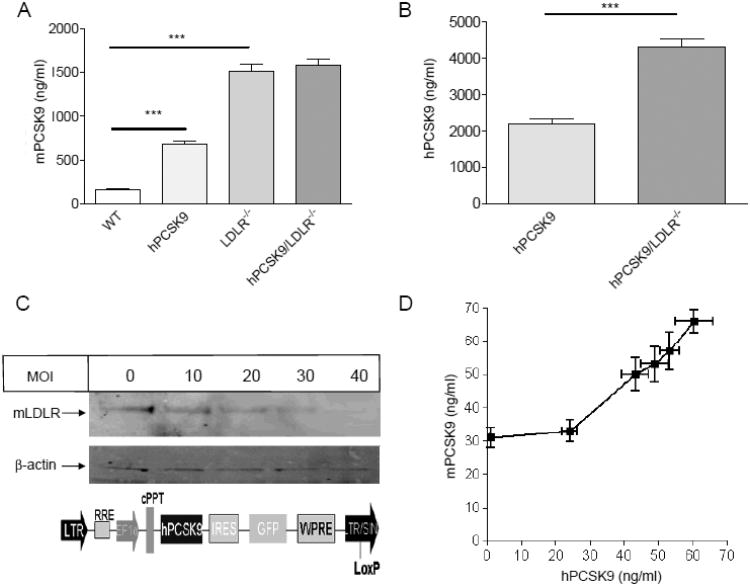
Figure 3.
hPCSK9 effect on mPCSK9 level in WT and LDLR−/− background mice. (A) Serum mPCSK9 levels. Results for mPCSK9 levels in hPCSK9 transgenic mice take into account 5% cross-reactivity with hPCSK9. (B) Serum hPCSK9 levels. Notice the different scale in A vs. B. Mice (n=9-16) were 6-8 month old, non-fasted, and on a chow diet. (C) Immunoblot of LDLR and β-actin in transduced mouse Aml-12 hepatocyte; the bi-cistronic lentiviral DNA construct pWPI-hPCSK9. (D) Secretion of mPCSK9 as a function of hPCSK9 levels in transduced Aml-12 cells. Transduction was performed in triplicate in each virus concentration (MOI); the vertical standard deviation is for measured mPCSK9 in the media and the horizontal standard deviation is for hPCSK9 measured in the same media. (*p<0.05, ** p<0.01, ***p<0.001).

