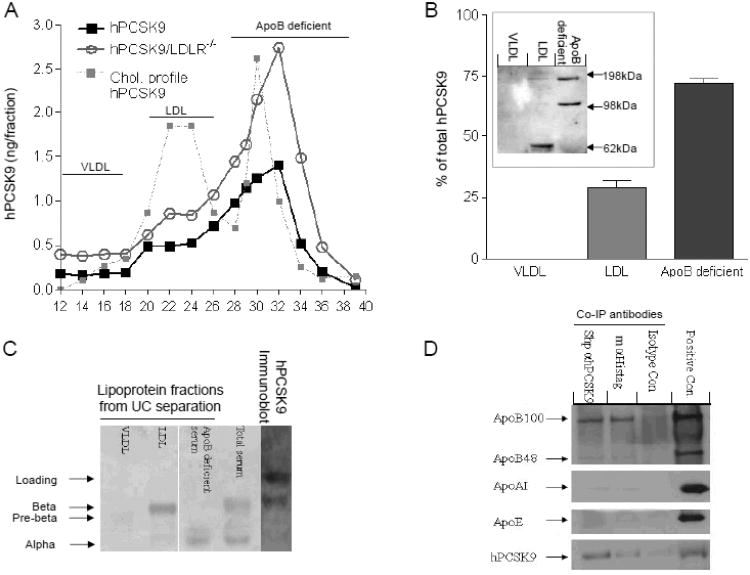
Figure 5.
Lipoprotein association of serum PCSK9. (A) Serum FPLC profile from hPCSK9 transgenic mice on either WT or LDLR−/− backgrounds. Each profile represents pooled serum from 3-4 mice, Fractions: VLDL 12-17, LDL 18-27, apoB-deficient serum (including HDL) 28-39. PCSK9 in each fraction was calculated as the area under the curve (AUC). (B) Relative hPCSK9 levels in transgenic mouse serum after UC using neutral density gradient medium (Optiprep). A pool of 21 mice was used for 3 different separations; Insert: hPCSK9 immunoblot from concentrated FPLC fractions of transgenic mouse serum. (C) Lipid staining of serum from transgenic mice after Optiprep UC (left) or direct immunoblot (right). (D) Apolipoprotein detection via immunoblot of hPCSK9 transgenic mouse serum following immunoprecipitation with anti-PCSK9 antibodies (m=Mouse, Shp=Sheep, Isotype control= Shp IgG). Serum from hPCSK9 transgenic mice served as positive control.

