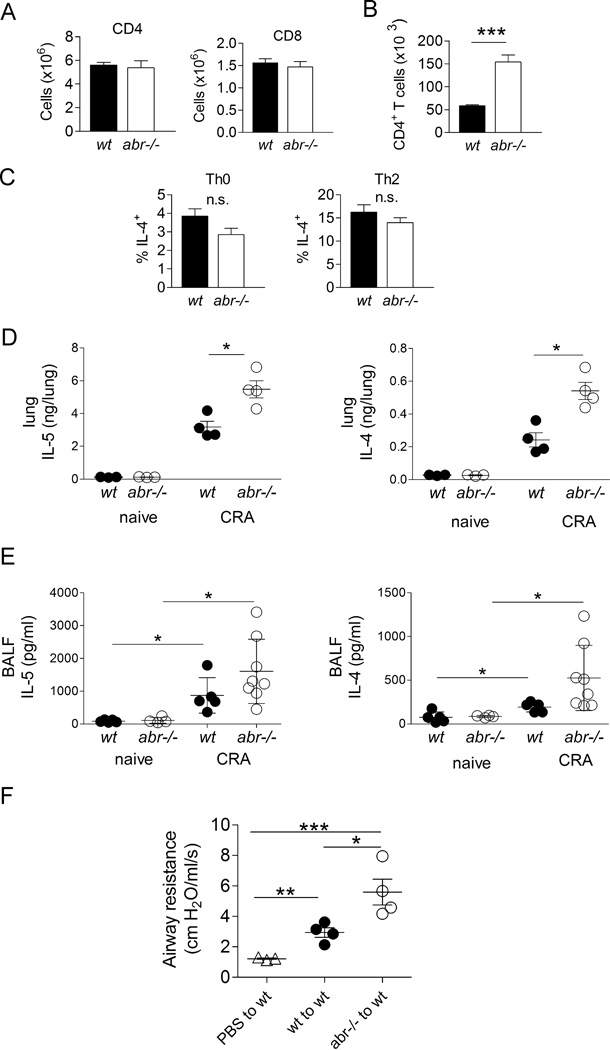
FIGURE 4. Increased CD4+ T cell involvement in asthmatic response of CRA-challenged abr−/− mice.
(A) Single cell suspensions of total lung of naive abr−/− and control mice evaluated by FACS for numbers of CD4+ or CD8+ T cells. (B) CD4+ T cell counts in BAL of CRA-immunized and challenged mice. For A–B, data of one experiment were shown, n = 3–4 mice/genotype. (C) Percentage of IL-4-producing CD4+ T cells in naïve wt and abr−/− mice. Splenic T cells cultured under Th0 or Th2 conditions for 2 days were incubated with PMA and ionomycin for 4 hr in the presence of brefeldin A. IL-4 was measured by intracellular staining. n = 4 mice/genotype. n.s., not significant. For A–C, data (mean ±SEM) were collected from 3–4 mice/genotype and analyzed by unpaired Student’s t test (***, p<0.001). (D) IL-4 and IL-5 in lung homogenates of naïve and CRA-immunized/challenged wt and abr−/− mice. (E) IL-4 and IL-5 in BALF of naïve control and CRA-immunized and challenged mice. (F) Airway resistance measurements after adoptive transfer of CD4+ T cells from CRA-challenged abr−/− mice into naïve wt mice. Splenic CD4+ T cells on day 21 (protocol in Fig. 2A) were transferred to naïve wt mice followed by intratracheal CRA challenge at 24 h and 72 h after adoptive transfer. Airway hyper-responsiveness was measured 24 h after the final CRA challenge. For D–E, data were analyzed by one-way ANOVA (*, p<0.05; **, p<0.01; ***, p<0.001). E, pooled data of two experiments with 4–5 control naïve mice per group and 5 wt and 8 abr−/− mice per treatment group. For C–D, one of two experiments with similar results. n = 3–4 mice per group.

