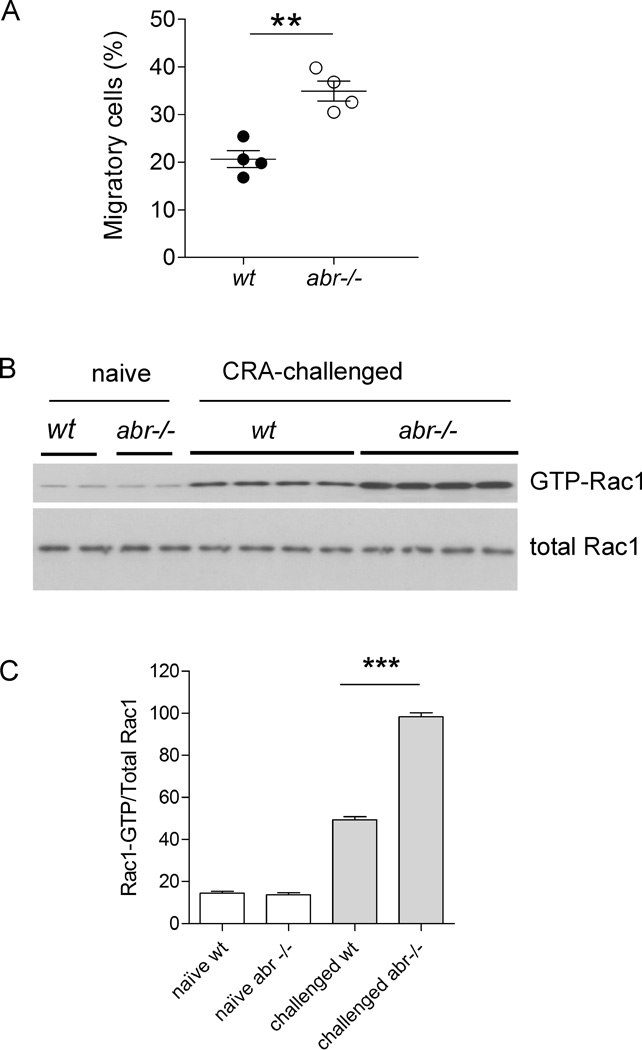
FIGURE 5. CD4+ T cells from CRA-challenged abr−/− mice show increased migration and elevated GTP-Rac1 levels compared to wt controls.
(A) CD4+ T cells were isolated from spleen on day 21 following the protocol in Fig. 2A. 1×10⁵ CD4+ T cells were seeded in the upper chamber of Transwells. Cells migrated to CCL21 in the lower chamber for 2 hr at 37°C. Migrating cells in the lower chambers were counted and expressed as % of the total cells. Data (mean±SEM) were analyzed by the Student’s t test (**, p<0.01). n = 4 mice per group. (B) Detection of activated Rac by Western blot in CD4+ T cells isolated from spleen on day 21 following the protocol in Fig. 2A. (C) Quantification of activated Rac1. The relative levels of activated Rac1 were calculated by normalizing the ratio of GTP-Rac1/Total Rac1. For A–C, results were similar in two independent experiments.

