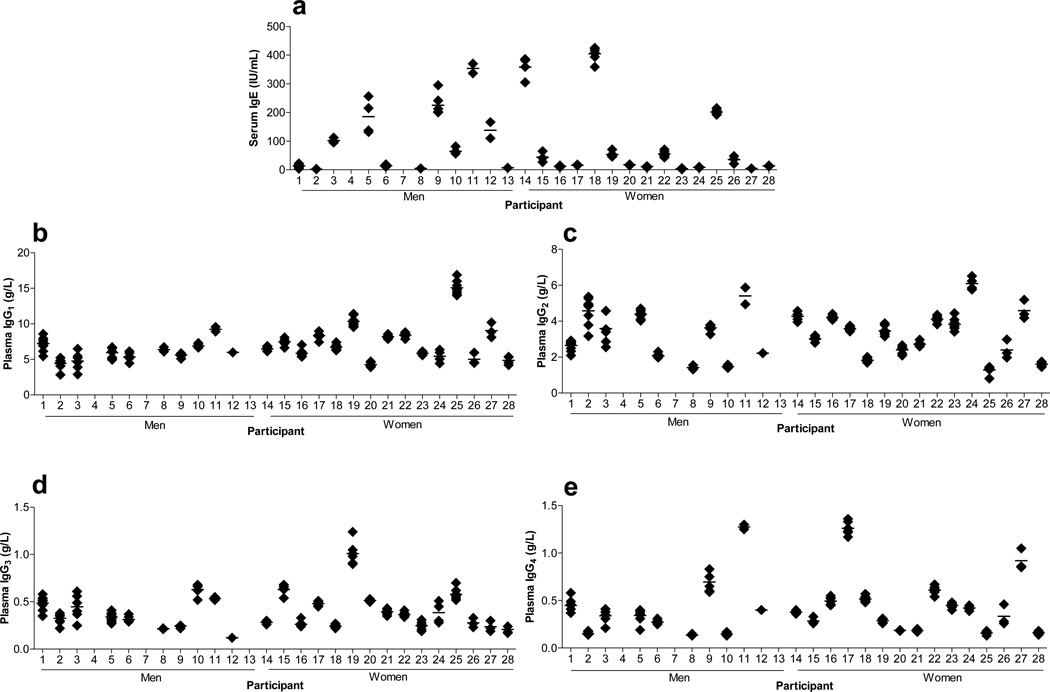
Fig. 4.
Quantitative immunoassay analyses of IgE and IgG1–4 immunoglobulin subclasses. (A) Serum was assayed for IgE by chemiluminescence assay; the analytical CV was 5%. (B–E) IgG1–4 subclasses were measured in plasma by immunochemical assay; analytical CVs were all <5%. Each point represents a single measurement collected over 18 months. Data in this figure originally appeared in Sallam R, Bernstein I, Tracy RP. The Cellular Epidemiology of Inflammation: The Biochemical Indices of T Helper Cells are Stable Phenotypes Related to Plasma Markers of Inflammation, Adiposity, and Hormonal Status. EJBMB 26 (Supplement): 453–472 (2008).

