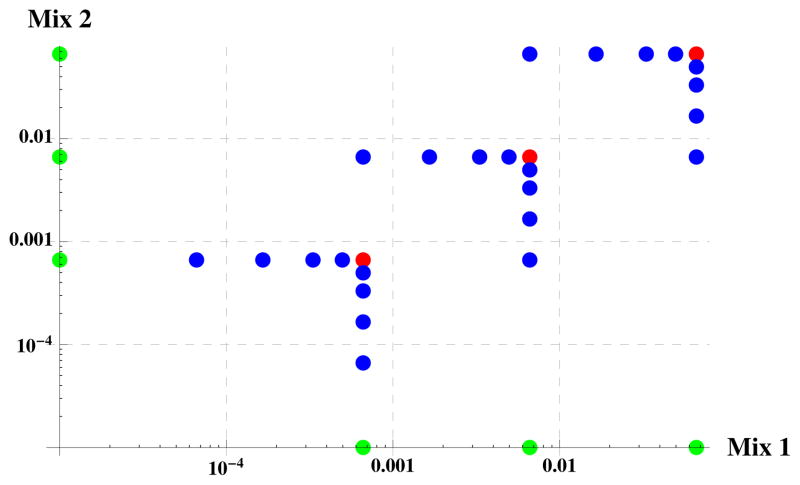
Figure 2. BIATECH-54 study design.
The log milligram (mg) fractional abundances (mg of protein/total mg in the sample) of proteins in Mix 1 and Mix 2 of the BIATECH-54 set. The blue, green and red points represent 1, 2 and 6 proteins, respectively (54 total). Those proteins for which zero mg was included in either sample are shown on the axes.

