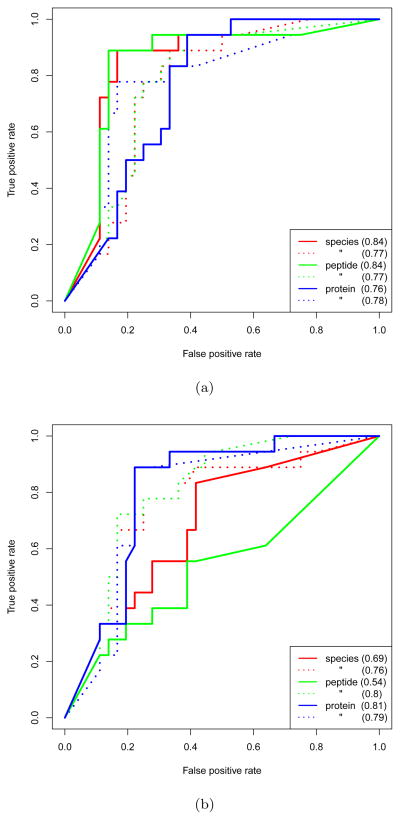
Figure 3. ROC comparison of performance.
ROC curves showing the performance of τr, computed using the spectral count (dotted) and ion abundance (solid) measures, in characterizing the relative abundance of proteins in Mix 1 and Mix 2 of the BIATECH-54 set across the species, peptide and protein rollup levels. (a) shows the results obtained using the data searched for fully-tryptic species, and (b) for semi-tryptic species. The AUC corresponding to each curve is shown in parenthesis.

