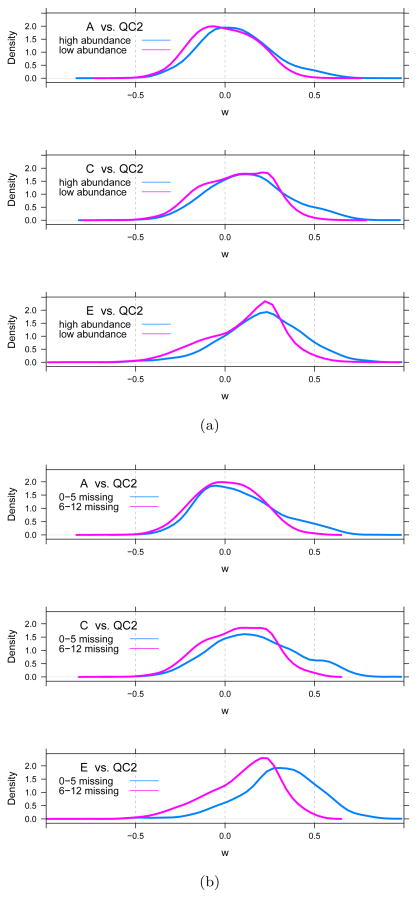
Figure 7. Stratified w for yeast species.
Density estimate of the distribution of the Wilcoxon statistic w for yeast species stratified by (a) the total ion abundance (low abundance is ≤ the median; high abundance is > median) and (b) the total number of missing observations (0–5 and 6–12), both as measured in the QC2 samples.

