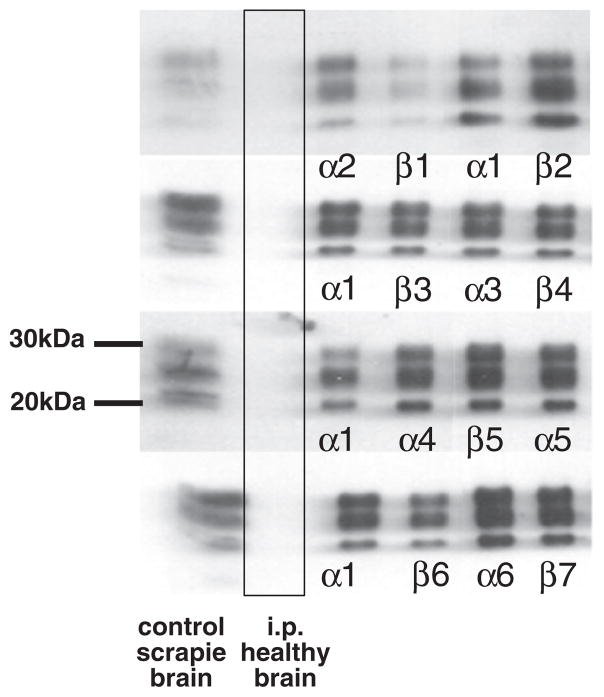
Fig. 2.
Analysis of brain of mice by Western-blotting demonstrates equal prion load in t-AUCB and vehicle treated mice. All samples were treated with proteinase K prior to SDS–PAGE separation. All animals were subjected to Western blot analysis with positive results (n = 15 for vehicle and n = 14 for t-AUCB group). Representative samples are shown in the figure. In the first column from the left brain homogenates of con-firmed positive control prion infected mice are displayed. The second column displays brain samples of negative control mice inoculated (i.p.) with brain homogenates of healthy mice. In subsequent columns α1–6 denote i.p. infected + vehicle animals and β1–7 denote i.p. infected + t-AUCB treated animals.

