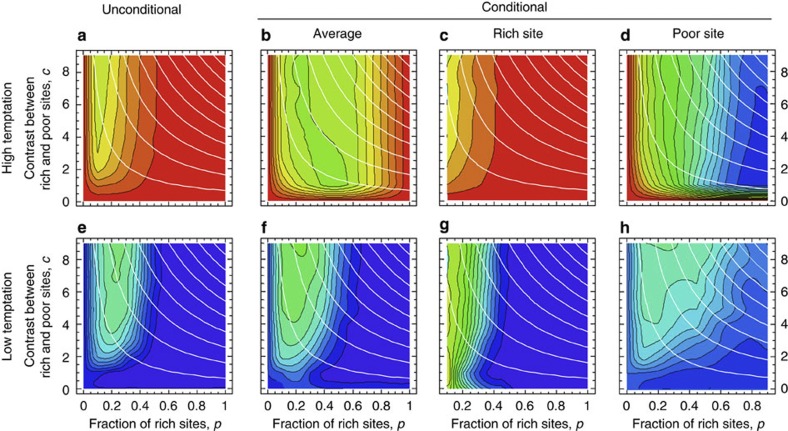
Figure 4. Evolved propensities to cooperate in heterogeneous environment.
Average equilibrium probabilities to cooperate are shown as a function of the fraction p of rich sites and the contrast c between rich and poor sites. Panels a and e show the evolutionary outcomes for unconditional strategies, whereas panels b–d and f–h show those outcomes for conditional strategies. In the latter case, the probabilities to cooperate when situated on a rich or poor site evolve independently. Average equilibrium probabilities to cooperate are shown in panels b and f. The mean equilibrium probabilities of cooperation of players on rich sites are shown on panels c and g, and the same for players on poor sites in panels d and h. All panels depict the fraction of cooperators through colour scales from 0 (red) to 1 (blue), based on five replicate model runs at each point, with increments of 0.1 in p and of 1 in c. Initial strategies were set to 0, implying defection on both rich and poor sites. As in Fig. 2, white lines represent iso-wealth curves. Results are recorded after 2 × 10⁹ steps. Other parameters: m=10 and b−1=0.7 (high temptation; a,c,d) or b−1=0.1 (low temptation; b,e,f).

