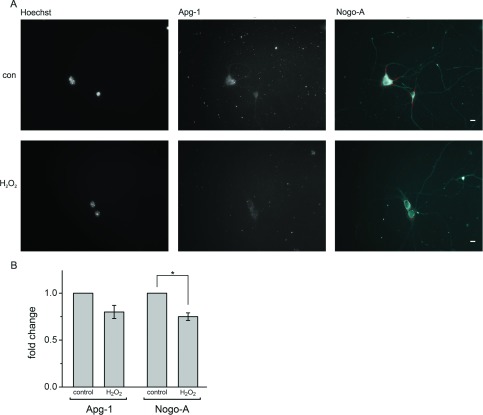
Figure 6. Down-regulation of Nogo-A and Apg-1 under oxidative stress.
(A) Hippocampal neurons were cultured for 4 days in vitro and exposed to H2O2 for 15 h, fixed and stained for Nogo-A and Apg-1. Single-cell semi-quantitative immunocytochemistry was performed by defining a primary object area in the Nogo-A channel (red line). Pixel intensity was measured within this primary object area in both the Nogo-A and Apg-1 channels and related to the number of Nogo-A-positive cells with an intact nucleus to yield the pixel intensity per neuron. Scale bar, 10 μm. (B) Quantification of single-cell Nogo-A and Apg-1 immunofluorescence under control conditions and following H2O2 treatment. Four independent experiments with a total number of approximately 400 neurons were analysed (Apg-1 compared with control: P=0.061, n=4; Nogo-A compared with control: *P=0.018, n=4; one-sample t test with Holm correction for multiplicity). con, control.

