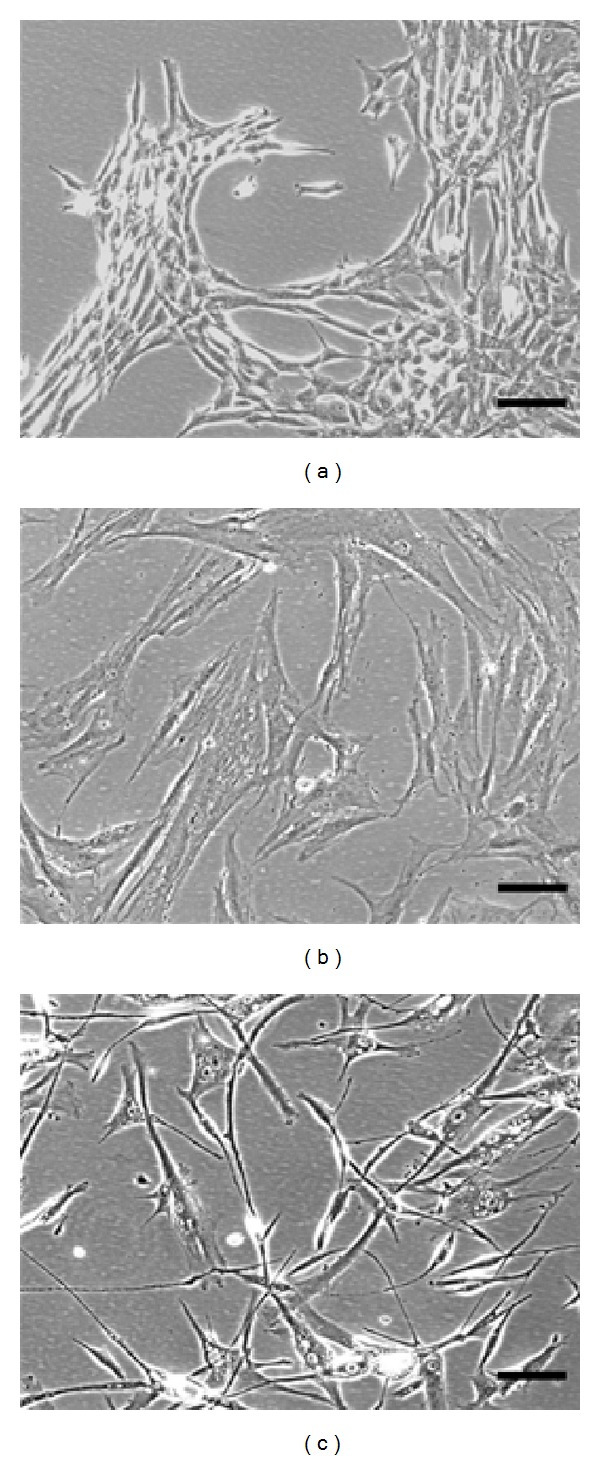
Figure 1.

Morphology of hMSC colonies. Morphology of subconfluent hMSC colonies at day 8 cultivated in either MSCGM-CD (a), MSCGM (b), or PowerStem (c). 7 mL of bone marrow per donor were seeded in respective media. Representative pictures have been taken at 100x magnification. Scale bar (black) length = 100 μm.
