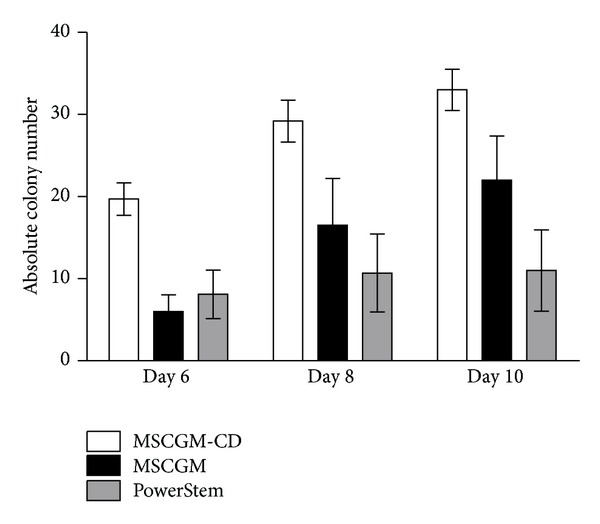
Figure 2.

Quantity of hMSC colonies. Quantity of hMSC colonies at days 6, 8, and 10 grown in MSCGM (black), MSCGM-CD (white), and PowerStem (grey) growth medium, respectively. Data presented as mean ± SEM (n = 10). Unpaired two-tailed t-test was performed for statistical analysis. Differences were not significant between groups.
