
Figure 4.
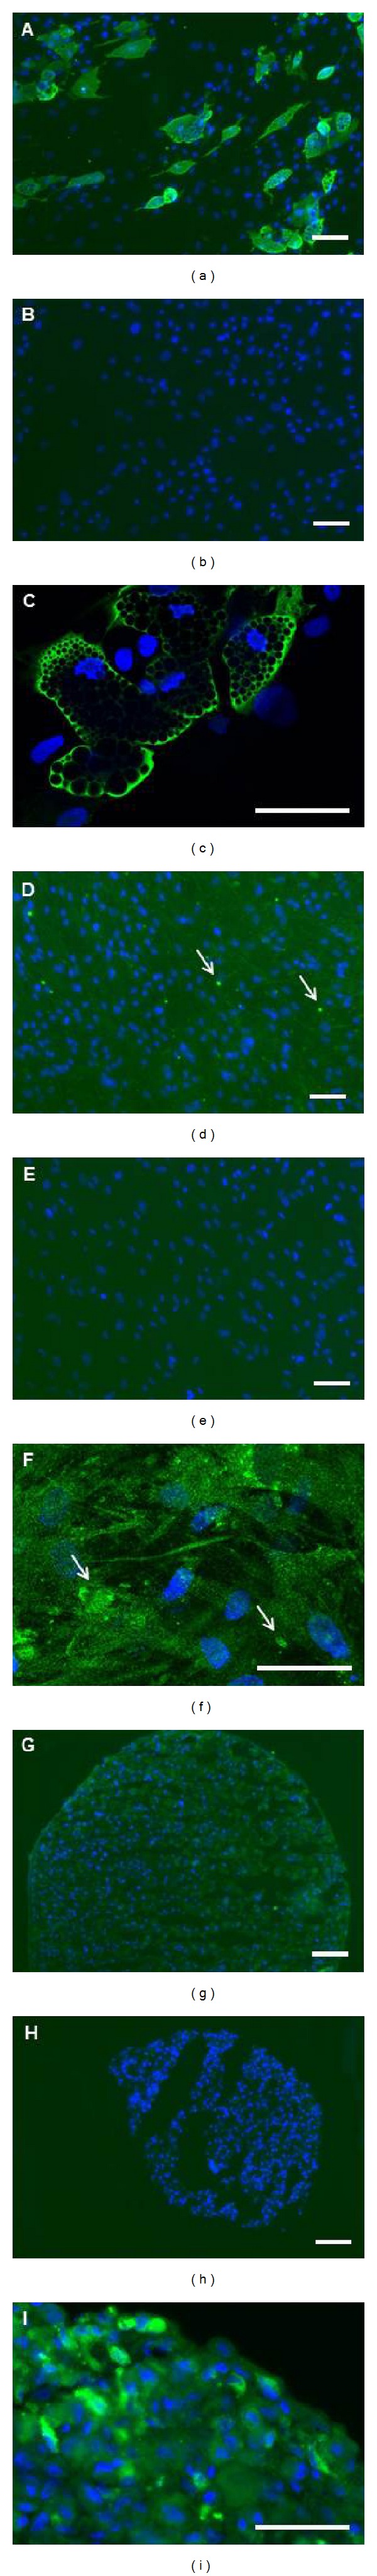
Microscopic characterization of differentiated hMSCs. Phenotypes of hMSCs after 21 days in adipogenic (a)–(c), osteogenic (d)–(f), and chondrogenic (g)–(i) differentiation culture. Images of unstained cells (b), (e), and (h) and images of immunocytochemically stained differentiated cells (a), (c), (d), (f), (g), and (i). Green color displays lineage specific proteins. Adipogenic commitment is shown by staining against fatty acid binding protein-4 (a) and (c), osteogenic commitment by antiosteocalcin staining (d) and (f), and chondrogenic differentiation by staining against aggrecan (g) and (i). Nuclei were counterstained with DAPI (blue). Pictures (b), (e), and (h) show negative controls (secondary antibody only). Arrows (d), (f) indicate accumulations of osteocalcin. These representative pictures have been taken at 100x ((a), (b), (d), (e), (g), (h), scale bar length = 100 μm) and 400x ((c), (f), (i), scale bar length = 50 μm) magnification.