
Figure 1.
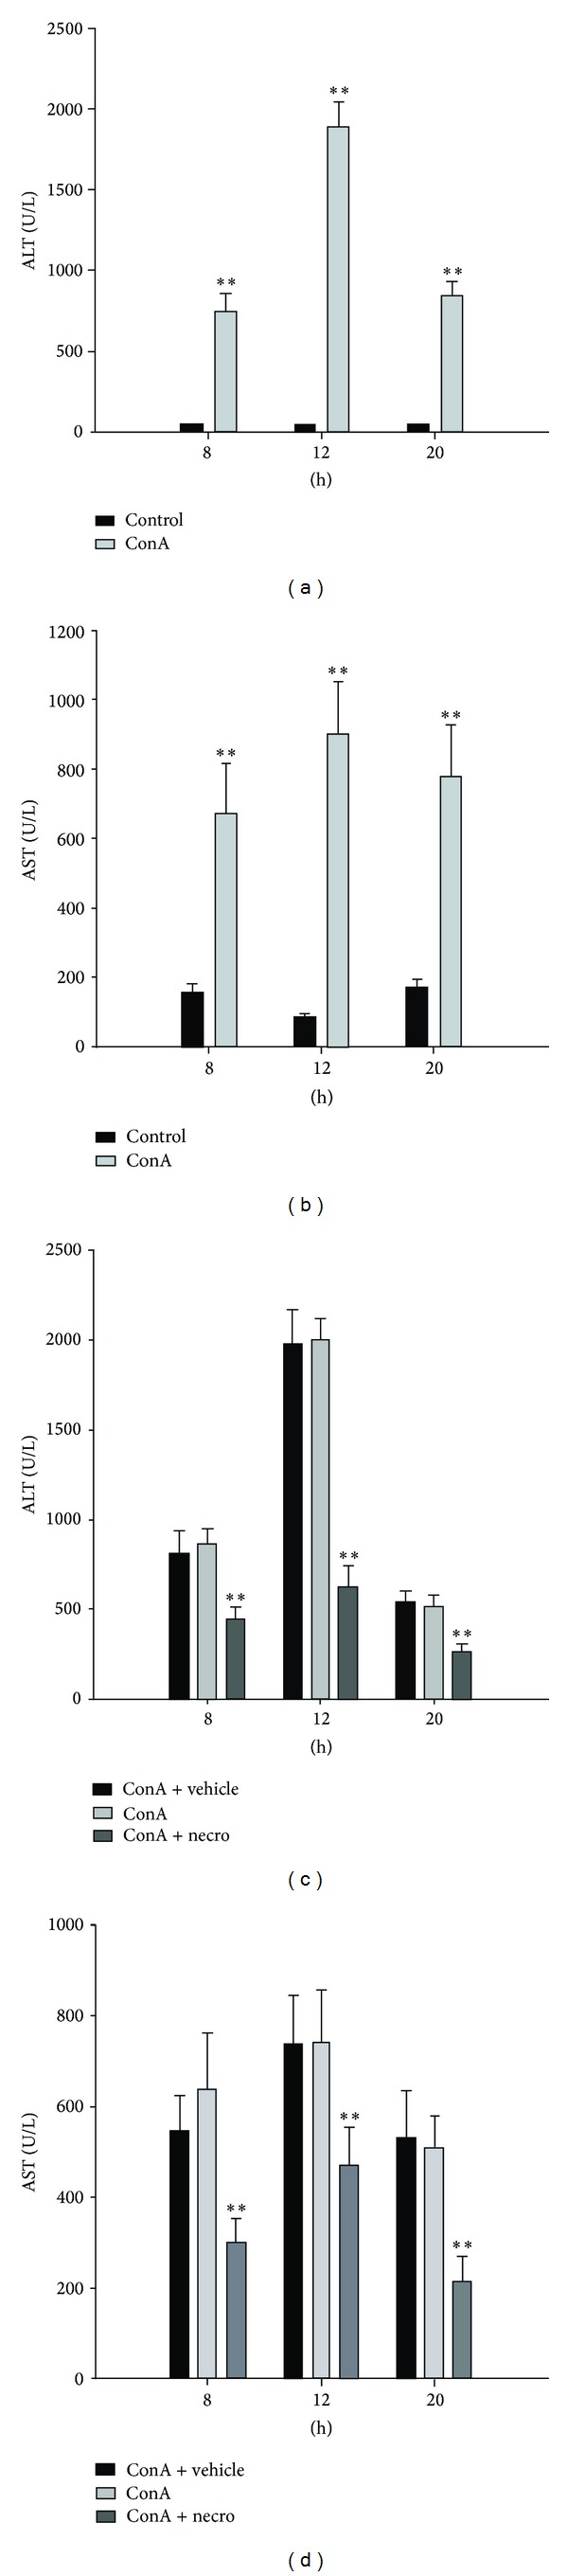
Induction of liver injury by ConA in model mice and Nec-1-treated mice. ((a)-(b)) Plasma ALT and AST levels in mice at 8, 12, and 20 h after ConA injection. Data are expressed as means ± SD (n = 10 mice, **P < 0.01). ((c)-(d)) Serum ALT and AST levels were measured at 8, 12, and 20 h after ConA injection in the vehicle-treated, control, and Nec-1-treated mice. Each value is a mean ± SD (n = 10 mice, **P < 0.01).