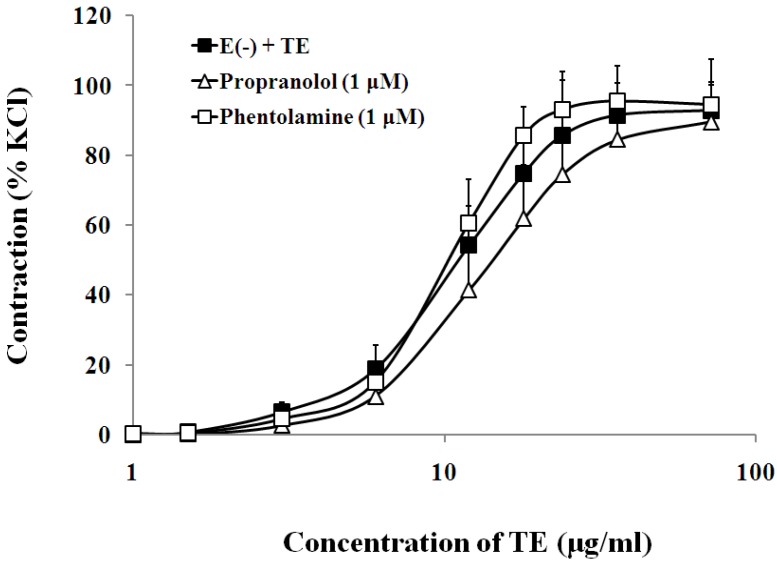
Figure 7.
Effects of propranolol (Δ) or phentolamine (□) on the TE-induced (1.5–72 μg/mL) concentration-contraction response curve in the endothelium-denuded aorta rings. Data are shown as the mean ± SD and expressed as the percentage of the maximum KCl contraction (n = 6). E (−): endothelium- denuded. * p < 0.05 vs. E (−) + TE.

