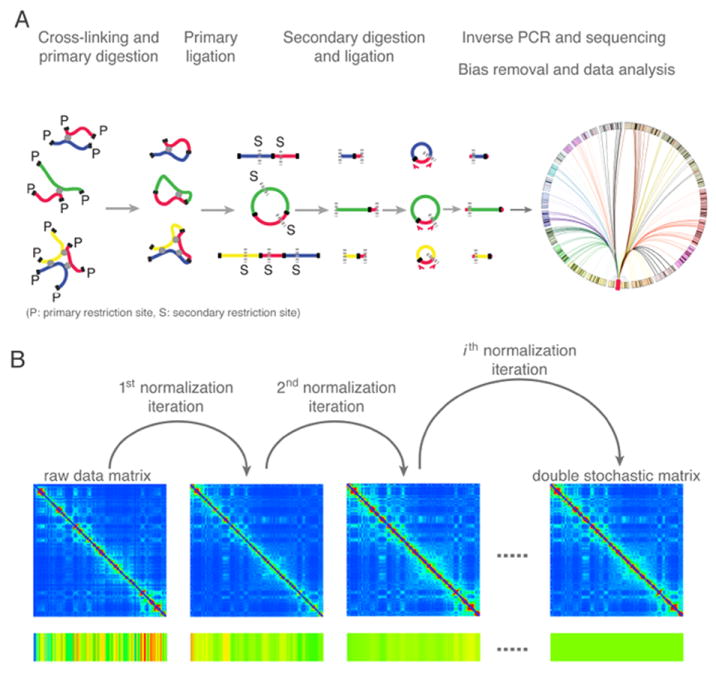
Figure 1.

A. Overview of the high-resolution 4C-seq method1, 8. The illustration shows three possible contacts between the viewpoint DNA fragment (red) and other fragments (blue, green, and yellow) mediated by proteins (depicted as grey circles). First, cross-linked chromatin is digested with a 4-base cutting primary restriction enzyme (cutting sites “P” are depicted as solid black lines), followed by proximity ligation. Subsequently, the cross-links are reversed, and DNA fragments are digested with a second, different 4-base cutting restriction enzyme (cutting sites “S” are depicted as dotted grey lines), followed by circularization. Captured fragments containing the viewpoint sequence are then amplified by inverse PCR, followed by high-throughput sequencing. Finally, the “one versus all” contact map is established by computational analysis. B. Illustration of the iterative correction procedure on raw chromosome conformation capture data10. The color bar at the bottom represents the magnitude of the row sums. In an iteration, each entry of the matrix is divided by the product of the visibility biases of the two interacting regions, where the bias of a region is calculated as the normalized sum of the corresponding row. After several iterations, the Hi-C map converges to a normalized matrix where each row and column sums to 1.
