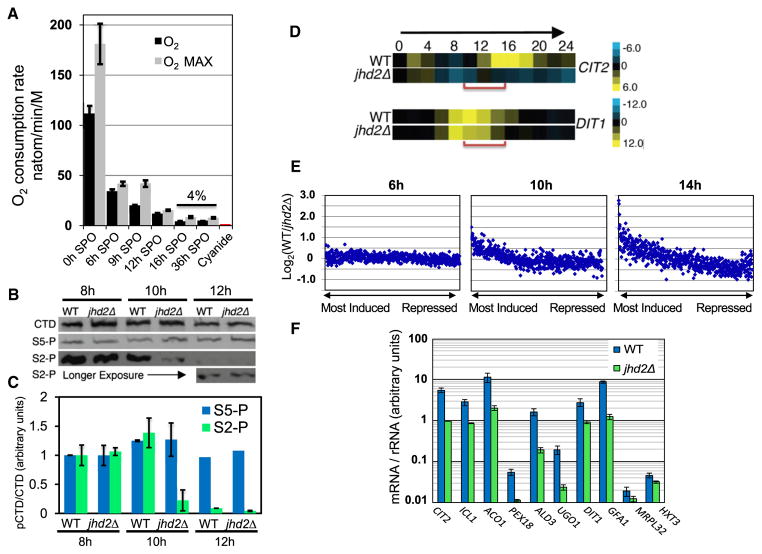
Figure 2. JHD2 Promotes Global Transcription in Opposition to Programmed Quiescence during Sporulation.
(A) Mitochondrial respiration rates of sporulating cells were assessed by measurement of rate of dissolved oxygen consumption. Error bars represent one standard deviation of technical replicates. Maximal respiration rate (O2 MAX) was measured after addition of the respiratory chain uncoupler carbonyl cyanide m-chlorophenyl hydrazone. Cyanide was added to inhibit the mitochondrial electron transport chain (cytochrome C oxidase).
(B) Quantitative western blots of bulk RNA Pol II CTD (CTD) and RNA Pol II CTD phosphorylated on serine-2 (S2-P) or serine 5 (S5-P) from WT and jhd2Δ cells collected at the 8 hr, 10 hr, and 12 hr time points of sporulation.
(C) Quantification of four technical replicates of western blot data described in (B), normalized to the 8 hr time points. Error bars represent 1 SD. See also Figure S2.
(D) Relative transcript abundance of CIT2 and DIT1 from 24 hr sporulation time course microarray profiles are shown.
(E) mRNA signals were ranked in WT cells at 6 hr, 10 hr, and 14 hr into the sporulation program. The differences in mRNA signal from jhd2Δ was calculated, averaged over bins of 10 genes, and displayed as scatter plots. See also Figures S2C, S2D, and Table S2.
(F) RT-qPCR was used to measure transcript abundance of the indicated genes at the 10 hr time points of independent sporulation time courses. Error bars represent 1 SD of technical replicates.

