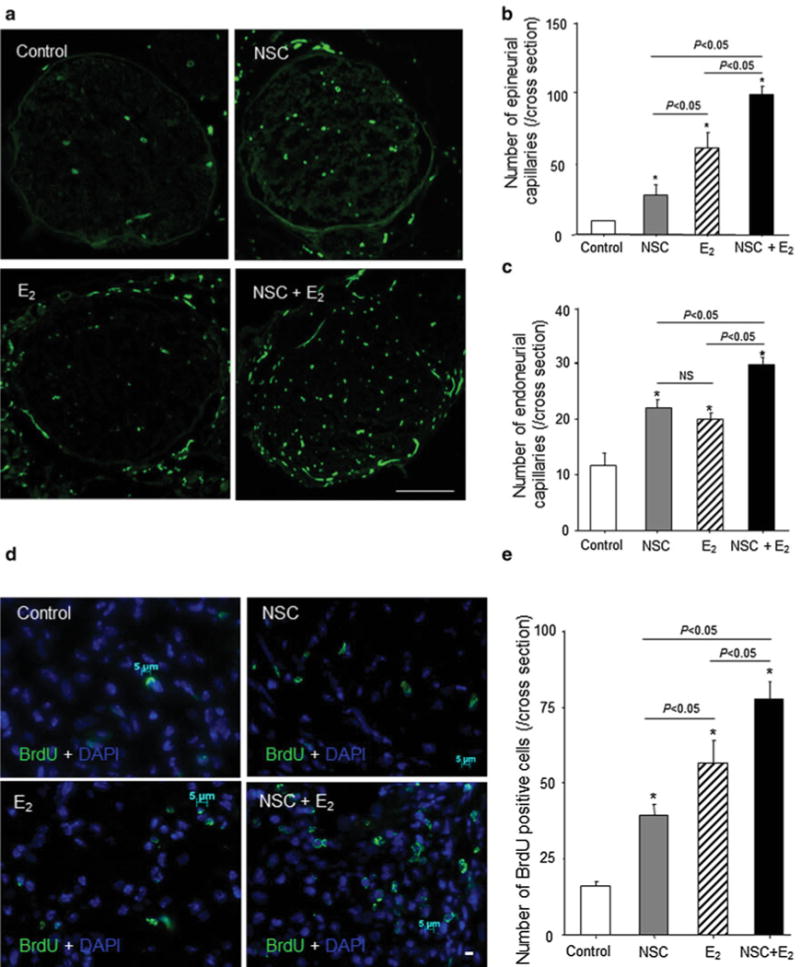
Fig. 5.

Intraneural neovascularization and cell proliferation after nerve crush injury. The sciatic nerves from injured mice were harvested 4 weeks after surgery for preparing cross-sections, which were examined by immunofluorescent staining for CD31. a The green shows CD31-positive capillaries. (n = 5 in each experimental group) Scale bar = 500 μm. b and c The graph shows capillary density in nerve cross-sections. The number of epineurial (b) and endoneurial (c) CD31-positive capillaries was counted in the same samples by fluorescent microscopy. *P < 0.05 versus control. d and e. The cell proliferation in injured nerve was evaluated by immunofluorescent staining for BrdU 1 week after surgery. Before 24 h prior to sacrifice, BrdU (1 mg/mouse) was administered intraperitoneally in each group (n = 5) d The green and blue represent BrdU-positive cells and DAPI-positive nuclei, respectively. Arrows indicate green and blue double-positive cells. Scale bar = 5 μm. e The BrdU-positive cell numbers were counted in each group. (n = 5 in each experimental group) Y-axis represents the number of BrdU-positive cells in entire cross-sections. *P < 0.05 versus control. (Color figure online)
