
Fig. 6.
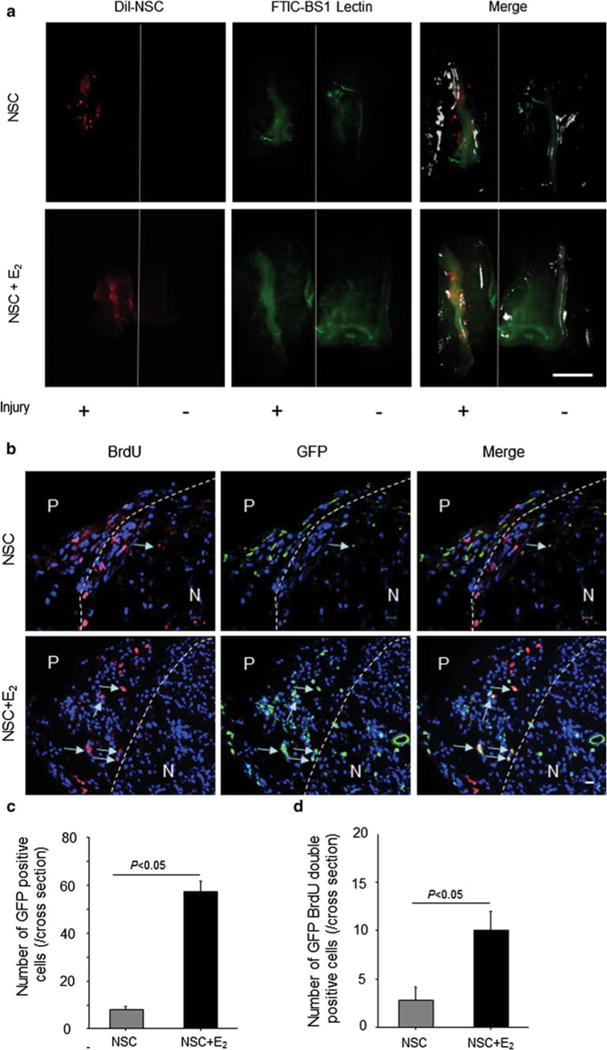
NSC incorporation into injured nerve. a The mice were anesthetized and injected with FITC-BS1 lectin via a tail vein. Fifteen minutes after injection, the back skin was removed from the body in each mouse, and the mice were scanned by in vivo imaging (OV100) at 7 days after surgery. The red shows DiI-labeled NSCs, and the green shows functional vascular staining. Scale bar = 5 mm. b The sciatic nerves were harvested 7 days after injury and stained with an antibody for GFP immunohistochemically. The green shows recruited NSCs isolated from GFP mice. Arrows, GFP and BrdU double positive NSCs. P perineurium; N nerve. Scale bar = 10 μm. c The graph shows the number of GFP-positive cells in entire nerve cross-sections. The gray bar represents the results in NSC monotherapy group (NSC), and the black bar represents the results in NSC/E2 combination therapy group (NSC + E2). (n = 5 in each experimental group). d Quantification of GFP and BrdU double-positive cells in entire nerve cross-sections. The gray bar represents the results in NSC monotherapy group (NSC), and the black bar represents the results in NSC/E2 combination therapy group (NSC + E2). (n = 5 in each experimental group). (Color figure online)