. 2013 Sep 30;2013:609151. doi: 10.1155/2013/609151
Copyright © 2013 D. Shahbazi-Gahrouei and M. Abdolahi.
This is an open access article distributed under the Creative Commons Attribution License, which permits unrestricted use, distribution, and reproduction in any medium, provided the original work is properly cited.
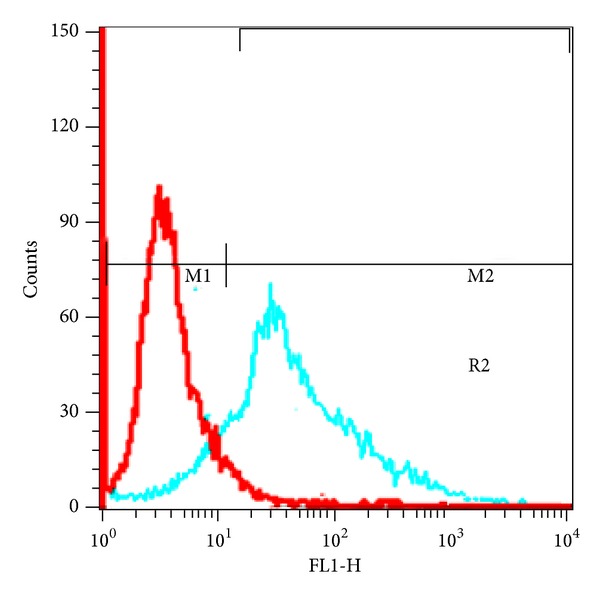
Figure 5.

Graphs of flow cytometry for OVCAR3 cell line.
