
Figure 2.
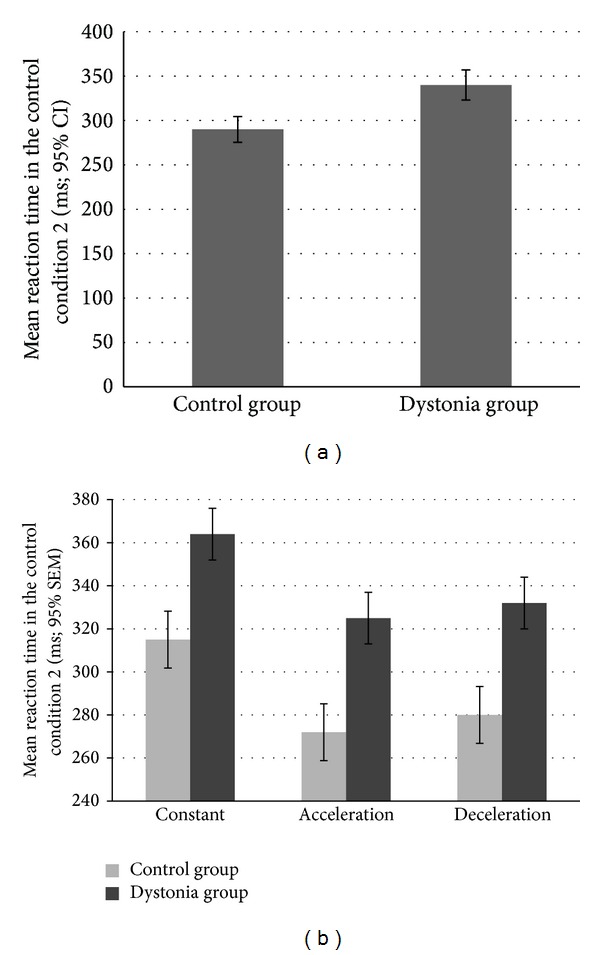
Reaction times. (a) Mean reaction time in the control condition 2: the reaction time of the patients was significantly slower than the reaction time in the control group. (b) Mean reaction times as a function of movement type in two groups: These results show that even if the patient group was generally slower (Figure 2), the reaction time was not affected by other parameters of the moving target (speed, acceleration) in a different way. This finding excludes the eventuality that the differences between the groups in the other main parameters may be due to oculomotor difficulties in the cervical dystonia group [37].