Figure 5.

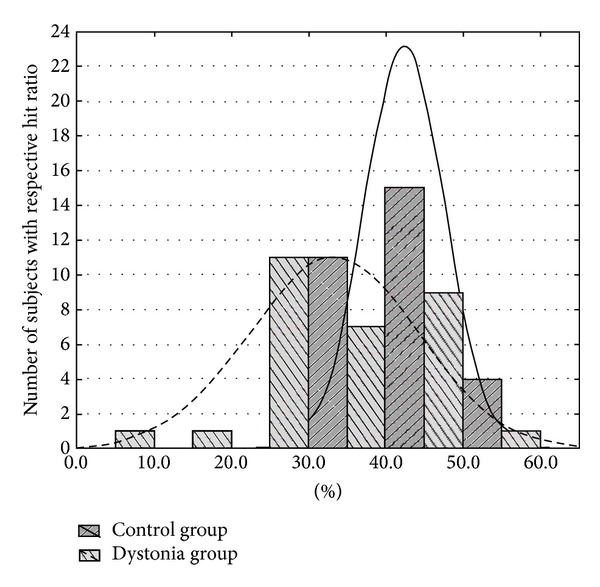
Histogram of hit ratios distributions in the patient group and the control group showing wider distribution curve for the cervical dystonia patients.

Histogram of hit ratios distributions in the patient group and the control group showing wider distribution curve for the cervical dystonia patients.