
Figure 6.
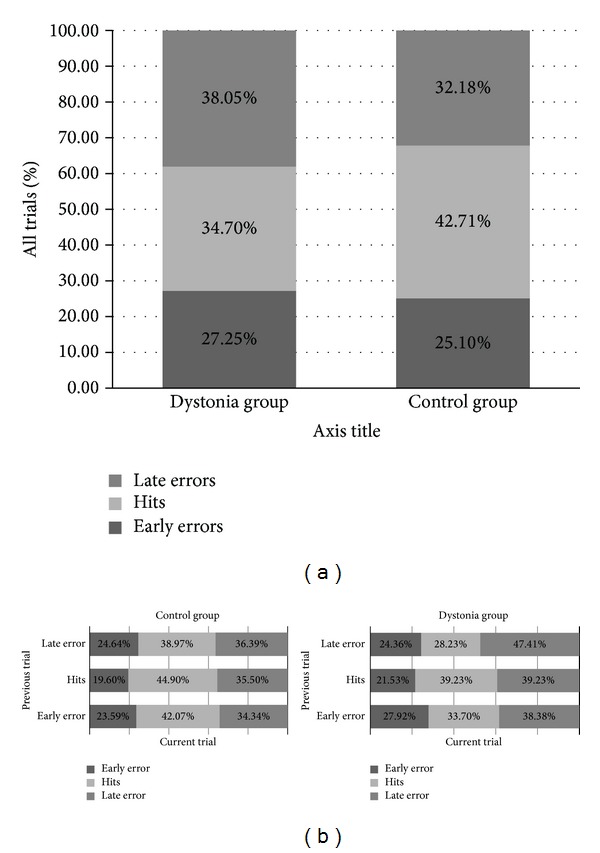
Error distribution. (a) Distribution of early and late errors in healthy subjects and cervical dystonia patients. (b) Trial-by-trial distribution of hits and errors: The effect of feedback and the impact of the success rate in the previous trial on the hit ratio and early/late errors distribution. In the graph, the error type distribution is presented as a function of the previous trial result.