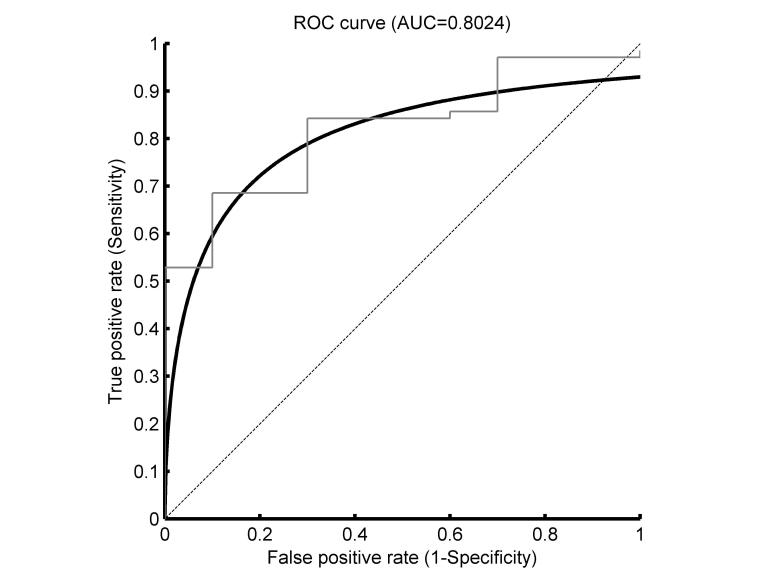
Figure 5.
Receiver operating characteristics (ROC) curve for using S_wBCST to predict SD driving performance, respectively to differentiate between subjects with good and poor DS performance. The thin gray line is the empirical curve, the solid black line is the smoothed (Gaussian-based) curve, and the dotted diagonal line indicates no discrimination (50% chance).

