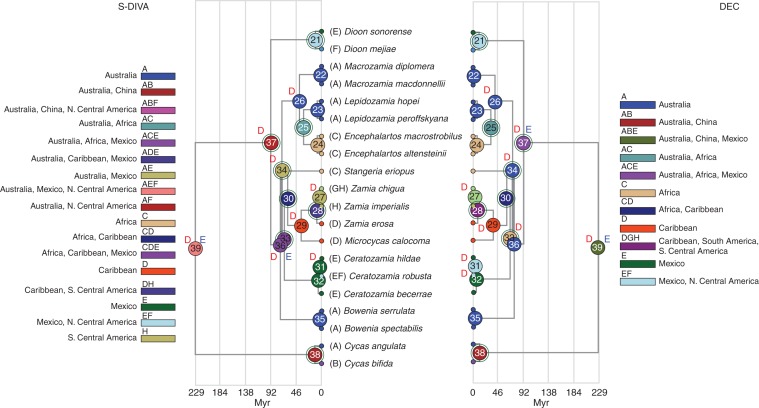
Fig. 5.
Chronogram from age estimation analysis in BEAST (Drummond et al., 2012) optimized with the most likely area on internal nodes as determined by S-DIVA (Yu et al., 2010) and DEC (Ree and Smith, 2008) biogeographic analyses. Green circles around nodes indicate vicariance, D = dispersal, E = extinction. See Table 4 for details.

