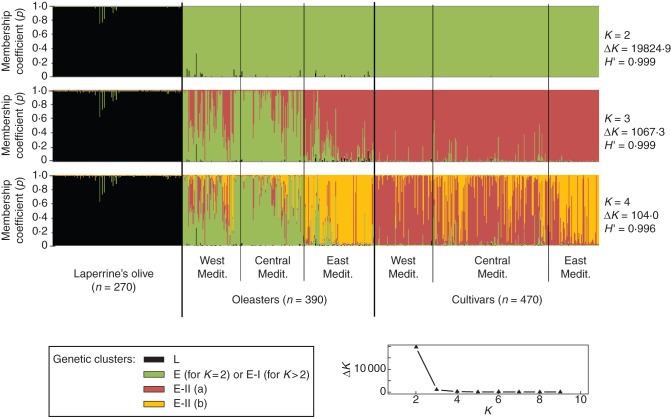
Fig. 2.
Inference of population structure based on ten nuclear SSRs using model-based Bayesian clustering implemented in STRUCTURE (Pritchard et al., 2000) on the whole data set (1130 individuals). Each vertical bar represents an individual. The membership coefficient of assignment (p) of each individual to different gene pools is shown for K = 2, K = 3 and K = 4 clusters. H′ represents the similarity coefficient between ten runs for each K, and ΔK is the ad-hoc measure of Evanno et al. (2005). The graph at the bottom right gives ΔK plotted against K. The three taxa (i.e. Laperrine's olive, oleasters and cultivars) are indicated, and three pre-defined regions are recognized for both oleasters and cultivars (Supplementary Data Tables S1 and S2). ‘West Mediterranean’ corresponds to accessions from Morocco and the Iberian Peninsula, ‘Central Mediterranean’ corresponds to accessions from Algeria to Libya and France to Continental Italy, and ‘East Mediterranean’ corresponds to accessions from Croatia to the Levant. The most likely genetic structure model is K = 2 clusters, according to ΔK and H' (ΔK = 19824·9 and H' = 0·999). At K = 2, each cluster corresponds to subspecies laperrinei and europaea (L and E, respectively), whereas at K= 3, numerous western and central oleasters (that mostly belong to cluster E-I) were shown to be distinguished from cultivars and eastern oleasters (that mostly belong to cluster E-II). At K = 4, most eastern oleasters and cultivars were distinguished from western/central cultivars (clusters E-IIa vs. E-IIb, respectively).

